. 2013;8(1):e54525.
doi: 10.1371/journal.pone.0054525. Epub 2013 Jan 16.

Inhibition of ceramide metabolism sensitizes human leukemia cells to inhibition of BCL2-like proteins

Affiliations

Inhibition of ceramide metabolism sensitizes human leukemia cells to inhibition of BCL2-like proteins

Lavona Casson et al. PLoS One. 2013.

Abstract

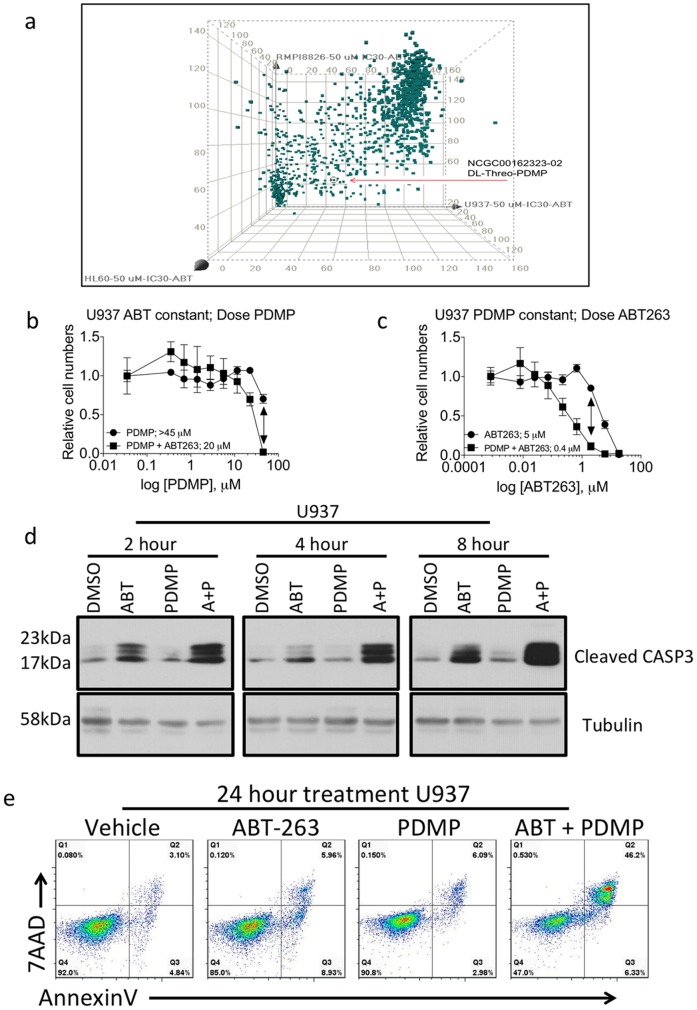
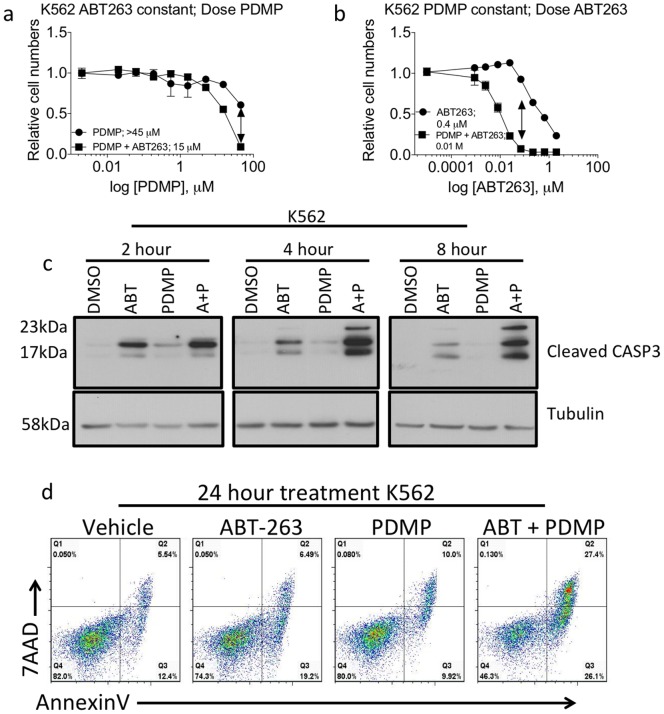
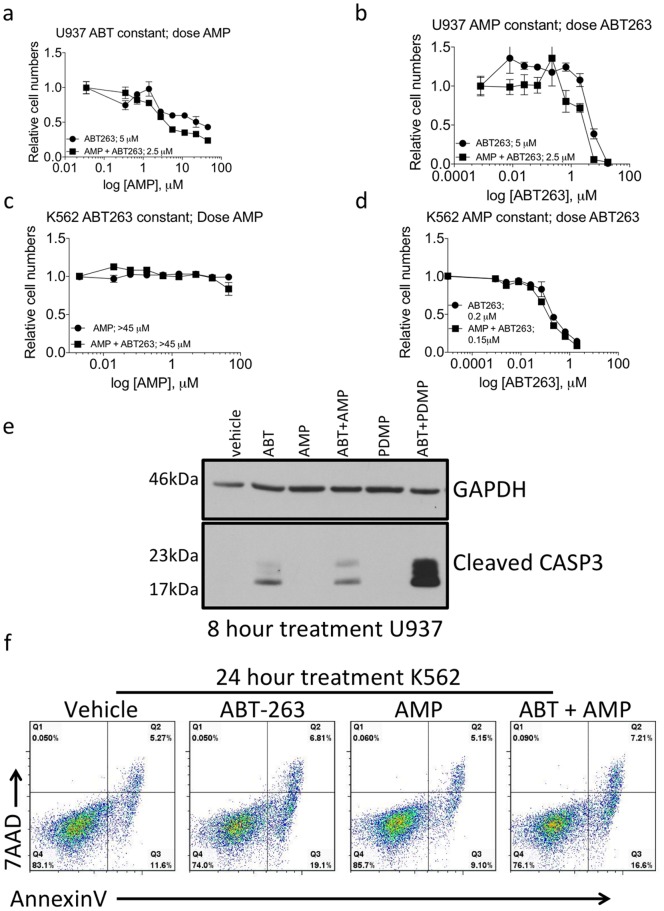
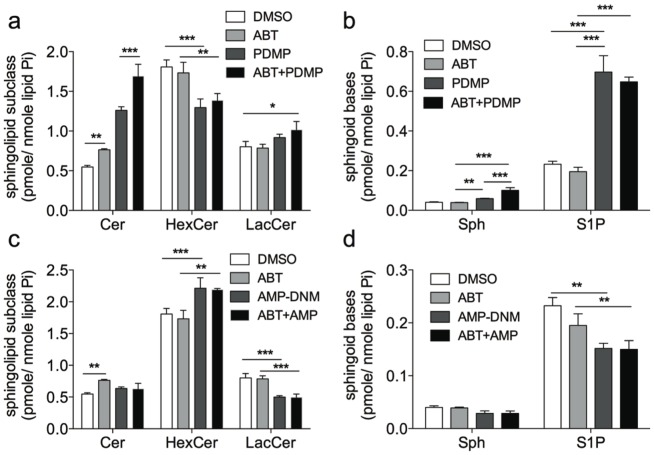
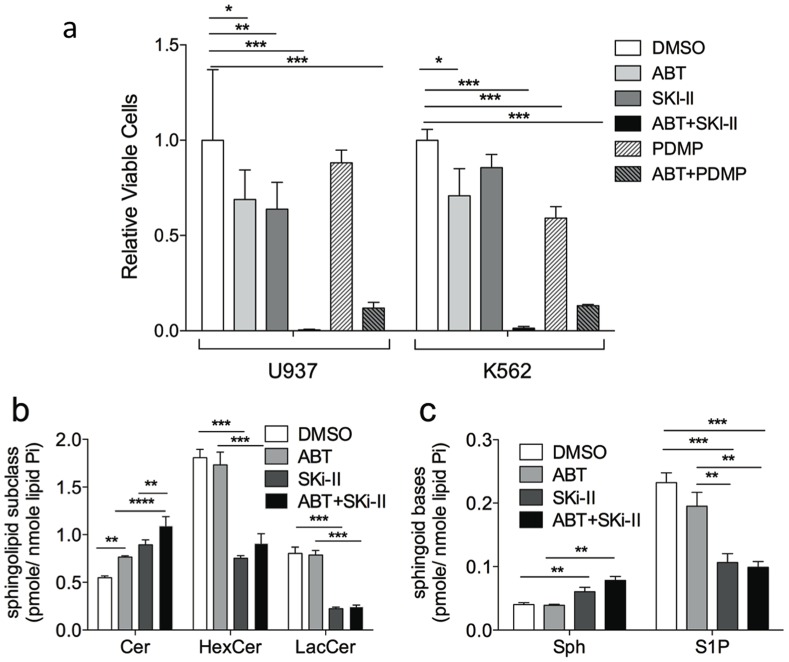
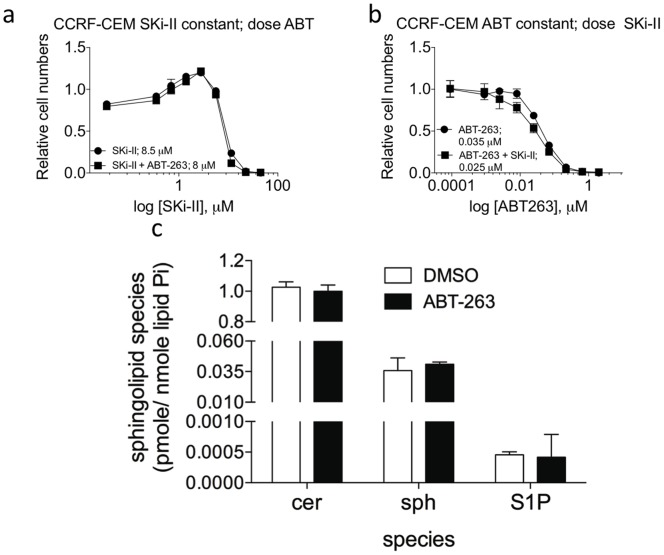
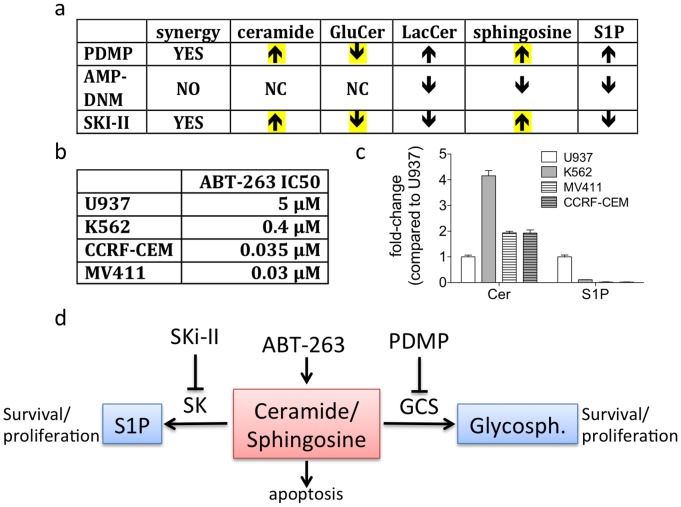
The identification of novel combinations of effective cancer drugs is required for the successful treatment of cancer patients for a number of reasons. First, many "cancer specific" therapeutics display detrimental patient side-effects and second, there are almost no examples of single agent therapeutics that lead to cures. One strategy to decrease both the effective dose of individual drugs and the potential for therapeutic resistance is to combine drugs that regulate independent pathways that converge on cell death. BCL2-like family members are key proteins that regulate apoptosis. We conducted a screen to identify drugs that could be combined with an inhibitor of anti-apoptotic BCL2-like proteins, ABT-263, to kill human leukemia cells lines. We found that the combination of D,L-threo-1-phenyl-2-decanoylamino-3-morpholino-1-propanol (PDMP) hydrochloride, an inhibitor of glucosylceramide synthase, potently synergized with ABT-263 in the killing of multiple human leukemia cell lines. Treatment of cells with PDMP and ABT-263 led to dramatic elevation of two pro-apoptotic sphingolipids, namely ceramide and sphingosine. Furthermore, treatment of cells with the sphingosine kinase inhibitor, SKi-II, also dramatically synergized with ABT-263 to kill leukemia cells and similarly increased ceramides and sphingosine. Data suggest that synergism with ABT-263 requires accumulation of ceramides and sphingosine, as AMP-deoxynojirimycin, (an inhibitor of the glycosphingolipid pathway) did not elevate ceramides or sphingosine and importantly did not sensitize cells to ABT-263 treatment. Taken together, our data suggest that combining inhibitors of anti-apoptotic BCL2-like proteins with drugs that alter the balance of bioactive sphingolipids will be a powerful combination for the treatment of human cancers.


Conflict of interest statement

Competing Interests: The authors have declared that no competing interests exist.

Figures

Figure 1
Figure 1. A screen identifies PDMP as a drug that can synergistically inhibit the growth of human leukemia cells when combined with ABT-263.
(A) Three human leukemia cell lines were screened against the LOPAC1280 compound library with and without the IC30 of ABT-737. A synergy score was calculated for each compound in the library and the scores of each compound are plotted as a component of each cell line. A lower score indicates a higher level of synergy. U937 cells are plotted on the x-axis, RPMI8226 cells are plotted on the y-axis and HL60 cells are plotted on the z-axis. The point on the graph representing PDMP is indicated. (B) Dose response curves of U937 cells were determined by treating the cells with either increasing doses of PDMP (350 nM to 45 µM) plus vehicle or increasing doses of PDMP (350 nM to 45 µM) and a constant dose of ABT-263 (2 µM). Inset values are the calculated IC50 from each curve. (C) Dose response curves of U937 cells were determined by treating the cells with either increasing doses of ABT-263 (8 nM to 18 µM) plus vehicle or increasing doses of ABT-263 (8 nM to 18 µM) and a constant dose of PDMP (45 µM). Arrows in (B) and (C) represent the equivalent doses of the respective drugs (2 µM ABT-263, 45 µM PDMP) and isobologram analysis indicated that the combination of the two drugs was synergistic with CI = <0.1. Inset values are the calculated IC50 from each curve. (D) Cells were treated with ABT-263 (2 µM), PDMP (45 µM) or the combination of drugs for 2, 4, or 8 hours and western blots for cleaved CASP3 were performed. (E) Cells were treated with either ABT-263 (2 µM), PDMP (45 µM) or the combination of drugs and 24 hours post treatment cells were stained with anti-AnnexinV antibody and 7AAD to determine the percent of cells undergoing apoptosis.
Figure 2
Figure 2. Validation of synergy in K562 cells, a line not used in the screen.
(A) Dose response curves of K562 cells were determined by treating the cells with either increasing doses of PDMP (350 nM to 45 µM) plus vehicle or increasing doses of PDMP (350 nM to 45 µM) and a constant dose of ABT-263 (60 nM). Inset values are the calculated IC50 from each curve. (B) Dose response curves of K562 cells were determined by treating the cells with either increasing doses of ABT-263 (2.2 nM to 5 uM) plus vehicle or increasing doses of ABT-263 (2.2 nM to 5 µM) and a constant dose of PDMP (45 µM). Arrows in (A) and (B) represent equivalent doses of the respective drugs (60 nM ABT-263, 45 µM PDMP) and isobologram analysis indicated that the combination of the two drugs was synergistic with CI = <0.1. Inset values are the calculated IC50 from each curve. (C) Cells were treated with ABT-263 (60 nM), PDMP (45 µM) or the combination of drugs for 2, 4, or 8 hours and western blots for cleaved CASP3 were performed. (D) Cells were treated with either ABT-263 (60 nM), PDMP (45 µM) or the combination of drugs and 24 hours post treatment cells were stained with anti-AnnexinV antibody and 7AAD to determine the number of cells that were undergoing apoptosis or were already dead.
Figure 3
Figure 3. Treatment of cells with AMP-deoxynojirimycin does not synergize with ABT-263.
(A) and (C) Dose response curves of U937 cells and K562 were determined by treating the cells with either increasing doses of AMP (350 nM to 45 µM) plus vehicle or increasing doses of AMP (350 nM to 45 µM) and a constant dose of ABT-263 (2 µM or 60 nM, respectively). (B) and (D) Dose response curves of U937 cells and K562 cells were determined by treating the cells with either increasing doses of ABT-263 (8 nM to 18 µM for U937, 2.2 nM to 5 µM for K562) plus vehicle or increasing doses of ABT-263 (8 nM to 18 µM for U937, 2.2 nM to 5 µM for K562) and a constant dose of AMP (45 µM). Inset values are the calculated IC50 from each curve. (E) U937 cells were treated with ABT-263 (2 µM), PDMP (45 µM) or the combination of drugs for 8 hours and western blots for cleaved CASP3 were performed. (F) Cells were treated with either ABT-263 (60 nM), PDMP (45 µM) or the combination of drugs and 24 hours post treatment cells were stained with anti-AnnexinV antibody and 7AAD to determine the number of cells that were undergoing apoptosis or were already dead.
Figure 4
Figure 4. Treatment of U937 cells with PDMP, but not AMP-DNM causes accumuliation of ceramide and sphingosine and a decrease in glucosylceramide.
(A) U937 cells were treated with ABT-263 (2 µM), PDMP (45 µM) or the combination of both drugs from two hours. Cells were harvested, lipids were extracted and the amounts of ceramide (Cer), hexosyceramine (HexCer) and lactosylceramide (LacCer) were quantitated. (B) U937 cells were treated with ABT-263 (2 µM), PDMP (45 µM) or the combination of both drugs from two hours. Cells were harvested, lipids were extracted and the amounts of sphingosine (Sph) and spingosine-1 phosphate (S1P) were quantitated. (C) U937 cells were treated with ABT-263 (2 µM), AMP-DNM (45 µM) or the combination of both drugs from two hours. Cells were harvested, lipids were extracted and the amounts of ceramide (Cer), hexosyceramine (HexCer) and lactosylceramide (LacCer) were quantitated. (D) U937 cells were treated with ABT-263 (2 µM), AMP-DNM (45 µM) or the combination of both drugs from two hours. Cells were harvested, lipids were extracted and the amounts of sphingosine (Sph) and spingosine-1 phosphate (S1P) were quantitated.
Figure 5
Figure 5. Inhibition of sphingosine kinase synergizes with ABT-263 to kill leukemia cells by causing accumulation of ceramide and sphingosine while decreasing glucosylceramide and S1P.
(A) U937 and K562 cells were treated with single doses of ABT-263 (2 µM U937, 60 nM K562), PDMP (45 µM), SKi-II (5 µM) or combinations of the indicated concentrations of ABT-263 and PDMP or ABT-263 and SKi-II and then alamar blue was used to determine the relative cell numbers after 48 hours of treatment. (B) U937 cells were treated with ABT-263 (2 µM), SKi-II (5 µM) or the combination of both drugs from two hours. Cells were harvested, lipids were extracted and the amounts of ceramide (Cer), hexosyceramine (HexCer) and lactosylceramide (LacCer) were quantitated. (C) U937 cells were treated with ABT-263 (2 µM), SKi-II (5 µM) or the combination of both drugs for two hours. Cells were harvested, lipids were extracted and the amounts of sphingosine (Sph) and spingosine-1 phosphate (S1P) were quantitated.
Figure 6
Figure 6. Inhibition of sphingosine kinase does not synergize with ABT-263 in killing CCRF-CEM cells.
(A) Dose response curves of CCRF-CEM cells were determined by treating the cells with either increasing doses of SKi-II (350 nM to 45 µM) plus vehicle or increasing doses of PDMP (350 nM to 45 µM) and a constant dose of ABT-263 (20 nM). Inset values are the calculated IC50 from each curve. (B) Dose response curves of CCRF-CEM cells were determined by treating the cells with either increasing doses of ABT-263 (0.9 nM to 2 µM) plus vehicle or increasing doses of ABT-263 (0.9 nM to 2 µM) and a constant dose of SKi-II (2 µM). Inset values are the calculated IC50 from each curve. (C) CCRF-CEM cells were treated with the IC30 of ABT-263 (20 nM) or vehicle (DMSO) for eight hours. Cells were harvested, lipids were extracted and the amounts of ceramide, sphingosine (Sph) and spingosine-1 phosphate (S1P) were quantitated.
Figure 7
Figure 7. Increased ceramide and sphingosine are important for synergy with ABT-263.
(A) Summary of the lipids that are altered following treatment of U937 cells with various inhibitors. (B) IC50 values of ABT-263 for individual human leukemia cell lines. Values were calculated in prism as the result of dose response curves determined by alamar blue assay 48 hours after ABT-263 treatment. (C) Total levels of basal ceramide (Cer) and sphingosine-1-phosphate (S1P) in four different cell lines as determined by HPLC-MS/MS. Data are normalized to the levels of lipids in U937. (D) Model depicting how different inhibitors affect sphingolipid metabolism.

References

    1. Hanahan D, Weinberg RA (2000) The hallmarks of cancer. Cell 100: 57–70. - PubMed
    1. Adams JM, Cory S (1998) The Bcl-2 protein family: arbiters of cell survival. Science 281: 1322–1326. - PubMed
    1. Tsujimoto Y (1998) Role of Bcl-2 family proteins in apoptosis: apoptosomes or mitochondria? Genes Cells 3: 697–707. - PubMed
    1. Perera MN, Lin SH, Peterson YK, Bielawska A, Szulc ZM, et al. (2012) Bax and Bcl-xL exert their regulation on different sites of the ceramide channel. Biochem J 445: 81–91. - PubMed
    1. Hannun YA, Obeid LM (2008) Principles of bioactive lipid signalling: lessons from sphingolipids. Nat Rev Mol Cell Biol 9: 139–150. - PubMed

Publication types

MeSH terms

LinkOut - more resources