

Prevalence and prediction of overweight and obesity among elementary school students
- PMID: 23343316
- PMCID: PMC3556912
- DOI: 10.1111/josh.12011
Prevalence and prediction of overweight and obesity among elementary school students
Abstract
Background: The high rates of childhood overweight and obesity in the United States have generated interest in schools as sites for monitoring body mass index (BMI) information. This study established baseline values for a 5-year longitudinal assessment of BMI of elementary school children and examined variation across the schools, because little is known about factors that affect the distribution of overweight and obesity within school districts.
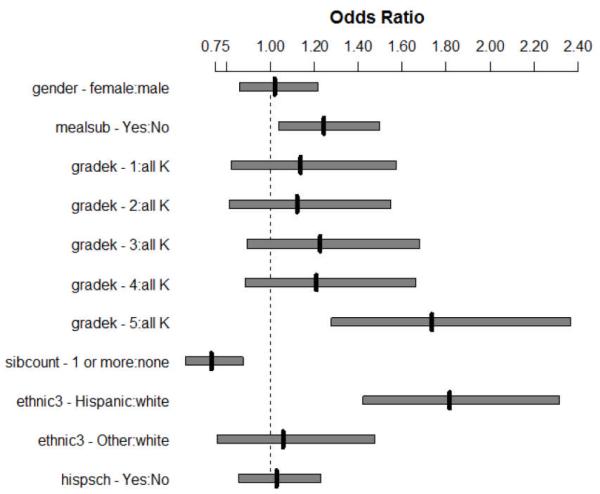
Methods: Height and weight measurements were collected on 2317 elementary school children in 1 school district. BMI was calculated using the Centers for Disease Control and Prevention's NutStat program. Child characteristics included gender, age, eligibility for free and reduced lunch (proxy for socioeconomic status [SES]), school, grade, and ethnicity/race. Children were grouped into 2 BMI categories, <85th percentile or ≥85th percentile (overweight/obesity). Logistic regression was used to examine potential predictors of overweight/obesity.
Results: Prevalence of ≥85th percentile was 30.9%, 34.4%, 35.3%, 36.4%, 37.1%, and 44.5% for K-5, respectively. Prevalence of ≥85th percentile was highest among Hispanic children. Ethnicity was the strongest predictor of inclusion in the ≥85th percentile category followed by grade and free and reduced lunch eligibility.
Conclusion: The data are consistent with the prevalence of overweight/obesity among American children and Hispanic children in particular. District prevalence of overweight/obesity is higher than available state statistics. Most of the BMI variation is accounted for by ethnicity, SES, and grade. The grade effect and high prevalence of overweight/obesity provide a rationale for BMI screening retention at the schools.
© 2013, American School Health Association.
Figures
Similar articles
-
Is urban-rural location associated with weight status in school children? An examination of 42 small and rural Californian counties.Rural Remote Health. 2017 Apr-Jun;17(2):3966. doi: 10.22605/RRH3966. Epub 2017 Apr 18. Rural Remote Health. 2017. PMID: 28415846
-
Identifying risk for obesity in early childhood.Pediatrics. 2006 Sep;118(3):e594-601. doi: 10.1542/peds.2005-2801. Pediatrics. 2006. PMID: 16950951
-
Trends in body mass index among Ohio's third-grade children: 2004-2005 to 2009-2010.J Acad Nutr Diet. 2013 Mar;113(3):440-446. doi: 10.1016/j.jand.2012.11.005. J Acad Nutr Diet. 2013. PMID: 23438495 Free PMC article.
-
Prevalence of overweight in north Florida elementary and middle school children: effects of age, sex, ethnicity, and socioeconomic status.J Sch Health. 2007 Nov;77(9):630-6. doi: 10.1111/j.1746-1561.2007.00243.x. J Sch Health. 2007. PMID: 17970867
-
Obesity and Overweight: Probing Causes, Consequences, and Novel Therapeutic Approaches Through the American Heart Association's Strategically Focused Research Network.J Am Heart Assoc. 2023 Feb 21;12(4):e027693. doi: 10.1161/JAHA.122.027693. Epub 2023 Feb 8. J Am Heart Assoc. 2023. PMID: 36752232 Free PMC article. Review.
Cited by
-
Exploring Categorical Body Mass Index Trajectories in Elementary School Children.J Sch Health. 2016 Jul;86(7):495-506. doi: 10.1111/josh.12402. J Sch Health. 2016. PMID: 27246674 Free PMC article.
-
Post-2000 growth trajectories in children aged 4-11 years: A review and quantitative analysis.Prev Med Rep. 2019 Mar 12;14:100834. doi: 10.1016/j.pmedr.2019.100834. eCollection 2019 Jun. Prev Med Rep. 2019. PMID: 30976485 Free PMC article. Review.
-
Factors Influencing School Health in Elementary Schools in Isfahan, Iran: A Qualitative Study.Int J Community Based Nurs Midwifery. 2016 Oct;4(4):352-362. Int J Community Based Nurs Midwifery. 2016. PMID: 27713898 Free PMC article.
-
Parent Safety Perceptions of Child Walking Routes.J Transp Health. 2014 Jun;1(2):108-115. doi: 10.1016/j.jth.2014.03.003. J Transp Health. 2014. PMID: 25664239 Free PMC article.
-
Model of goal directed behavior for limiting Latino preschoolers' television viewing: validity and reliability.BMC Public Health. 2020 Feb 5;20(1):185. doi: 10.1186/s12889-020-8268-x. BMC Public Health. 2020. PMID: 32024491 Free PMC article. Clinical Trial.
References
-
- Centers for Disease Control (CDC) Obesity rates among all children in the United States. [Accessed August 2, 2012]. 2011. Updated April 21. Available at: http://www.cdc.gov/obesity/childhood/data.html.
-
- Centers for Disease Control (CDC) How is childhood overweight and obesity measured? [Accessed August 2, 2012]. 2011. Basics about childhood obesity. Updated April 26. Available at: http://www.cdc.gov/obesity/childhood/basics.html.
-
- Ogden C, Carroll M. Prevalence of obesity among children and adolescents: United States, trends 1963-1965 through 2007-2008. [Accessed August 2, 2012]. 2010. NCHS Health E-Stat. Updated June 4. Available at: http://www.cdc.gov/nchs/data/hestat/obesity_child_07_08/obesity_child_ 0....
-
- Bethell C, Simpson L, Stumbo S, Carle AC, Gombojav N. National, state, and local disparities in childhood obesity. Health Aff. 2010;29(3):347–356. - PubMed
-
- Dietz WH. Health consequences of obesity in youth: childhood predictors of adult disease. Pediatrics. 1998;101(Suppl 2):S518–S525. - PubMed
Publication types
MeSH terms
Grants and funding
LinkOut - more resources
Full Text Sources
Other Literature Sources
Medical
Research Materials
