. 2013 Jan 23:14:29.
doi: 10.1186/1471-2105-14-29.

Detecting recurrent gene mutation in interaction network context using multi-scale graph diffusion

Affiliations

Detecting recurrent gene mutation in interaction network context using multi-scale graph diffusion

Sepideh Babaei et al. BMC Bioinformatics. .

Abstract

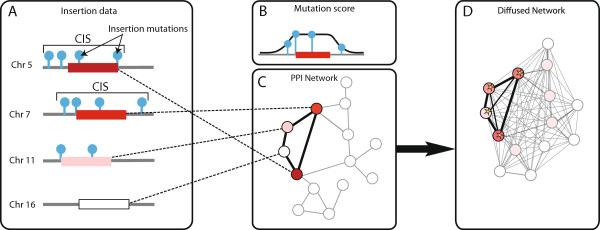
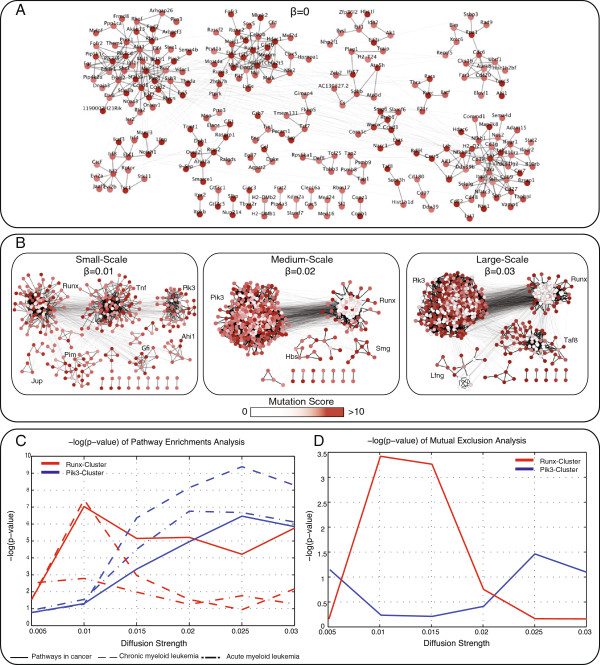
Background: Delineating the molecular drivers of cancer, i.e. determining cancer genes and the pathways which they deregulate, is an important challenge in cancer research. In this study, we aim to identify pathways of frequently mutated genes by exploiting their network neighborhood encoded in the protein-protein interaction network. To this end, we introduce a multi-scale diffusion kernel and apply it to a large collection of murine retroviral insertional mutagenesis data. The diffusion strength plays the role of scale parameter, determining the size of the network neighborhood that is taken into account. As a result, in addition to detecting genes with frequent mutations in their genomic vicinity, we find genes that harbor frequent mutations in their interaction network context.

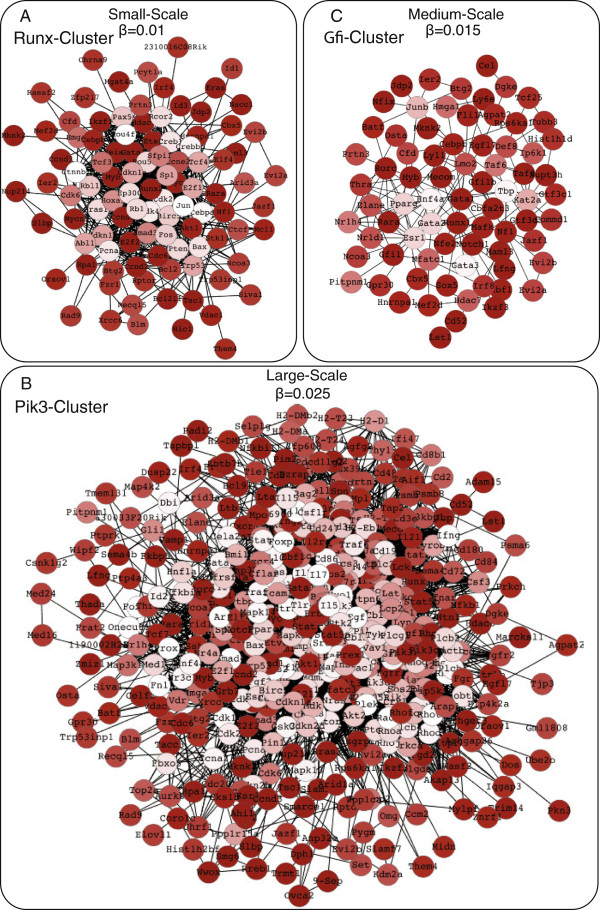
Results: We identify densely connected components of known and putatively novel cancer genes and demonstrate that they are strongly enriched for cancer related pathways across the diffusion scales. Moreover, the mutations in the clusters exhibit a significant pattern of mutual exclusion, supporting the conjecture that such genes are functionally linked. Using multi-scale diffusion kernel, various infrequently mutated genes are found to harbor significant numbers of mutations in their interaction network neighborhood. Many of them are well-known cancer genes.

Conclusions: The results demonstrate the importance of defining recurrent mutations while taking into account the interaction network context. Importantly, the putative cancer genes and networks detected in this study are found to be significant at different diffusion scales, confirming the necessity of a multi-scale analysis.


Figures

Figure 1
Figure 1
Framework. A) Insertion mutation data (blue lollipops, each occurring in one tumor) across a set of tumors (not shown) and four genomic regions. The region on Chr 5 and Chr 7 harbor sufficient mutations to be called CIS. The region on Chr 11 and Chr 16 do not. B) Gene mutation scores are obtained by weighted summarization. The weighing function is a flat-top Gaussian. C) PPI network with genes as nodes. Color denotes the mutation gene score. D) Illustration of the diffusion kernel. Conceptually, the diffusion kernel is similar to a heat diffusion process. In graphs this means that the mutation score at the graph node is diffused throughout the network dependent on the graph topology that connects this node to the rest of the network. Its global distance to the other nodes is thus dependent on the weight and number of paths connecting them as well as the diffusion strength. The latter parameter can be regarded as a scale parameter. For low diffusion strength, scores hardly diffuse and the interaction context of a gene is determined by itself and a few well-connected neighbors. For high diffusion strength, scores are almost fully diffused and can thus reach distant genes in the network, albeit in very small amounts. Using a permutation approach, it is possible to establish whether the diffused scores are higher than expected by chance (starred genes). Notably, genes with few or no mutations can still reach significance due to high scoring nodes in their neighborhood.
Figure 2
Figure 2
Gene clusters across the diffusion scales. A) The CIS genes shown in the context of the interaction network which are significant without any diffusion (β = 0). These genes represent the major sources of mutation score, and drive low scoring genes in the diffusion process. B) Overview of the identified ReMIC gene clusters at three scale levels: small-, medium- and large-scale. The color of the nodes reflects the mutation score before diffusion. Two major gene clusters, Runx- and Pik3-cluster are apparent across the scales. C)p-values of pathway enrichment analysis of three pathways in the KEGG database for two detected clusters in all diffusion scales. Both clusters are highly enriched for pathways in cancer across a range of scales. The Runx- and Pik3-cluster show strongest enrichment for the small- and large-scale, respectively. D)p-values of mutual exclusivity analysis for the two ReMIC gene clusters. Both clusters are significantly mutually exclusive across all scale levels. The minimum p-value is, however, attained for the scale at which the strongest KEGG enrichment was observed.
Figure 3
Figure 3
Prominent ReMIC gene clusters. ReMIC genes in the relevant diffusion scale of A) Runx-cluster (consisting of 100 ReMIC genes at the small-scale), B) Pik3-cluster (consisting of 436 ReMIC genes at the large-scale) and C) Gfi-cluster (consisting of 75 ReMIC genes at the medium-scale). The clusters are visualized using Organic Cytoscape layout [32]. The color of the nodes reflects the mutation score before diffusion.
Figure 4
Figure 4
Superimposed on the KEGG pathways. The white and pink ReMIC genes are co-localized in a confined part of the acute myeloid leukemia pathway. Non-CIS ReMIC genes in the Pik3- and Runx-cluster all co-localize in the top left (blue) and in bottom right (red), respectively.

References

    1. Greaves M. Cancer causation: the Darwinian downside of past success? Lancet Oncol. 2002;3(4):244–251. doi: 10.1016/S1470-2045(02)00716-7. - DOI - PubMed
    1. Maley CC, Galipeau PC, Li X, Sanchez CA, Paulson TG, Reid BJ. Selectively advantageous mutations and hitchhikers in neoplasms: p16 lesions are selected in Barrett’s esophagus. Cancer Res. 2004;64(10):3414–327. doi: 10.1158/0008-5472.CAN-03-3249. - DOI - PubMed
    1. Nowell PC. The clonal evolution of tumor cell populations. Science. 1976;194(4260):23–28. doi: 10.1126/science.959840. - DOI - PubMed
    1. Futreal PA, Coin L, Marshall M, Down T, Hubbard T, Wooster R, Rahman N, Stratton MR. A census of human cancer genes. Nat Rev Cancer. 2004;4(3):177–183. doi: 10.1038/nrc1299. - DOI - PMC - PubMed
    1. Sjöblom T, Jones S, Wood L, Parsons D, Lin J, Barber T, Mandelker D, Leary R, Ptak J, Silliman N, Szabo S, Buckhaults P, Farrell C, Meeh P, Markowitz S, Willis J, Dawson D, Willson J, Gazdar A, Hartigan J, Wu L, Liu C, Parmigiani G, Park B, Bachman K, Papadopoulos N, Vogelstein B, Kinzler K, Velculescu V. The Consensus Coding Sequences of Human Breast and Colorectal Cancers. Science. 2006;314(5797):268–274. doi: 10.1126/science.1133427. - DOI - PubMed

Publication types