

A new approach to evaluating statistical significance of spectral identifications
- PMID: 23343606
- PMCID: PMC5590104
- DOI: 10.1021/pr300453t
A new approach to evaluating statistical significance of spectral identifications
Abstract
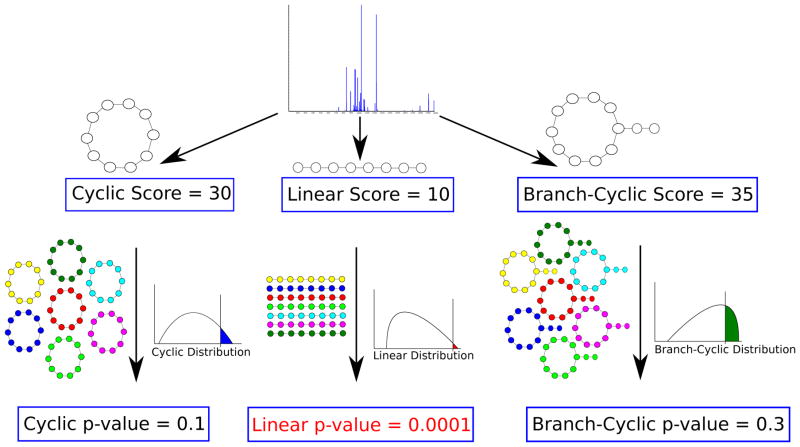
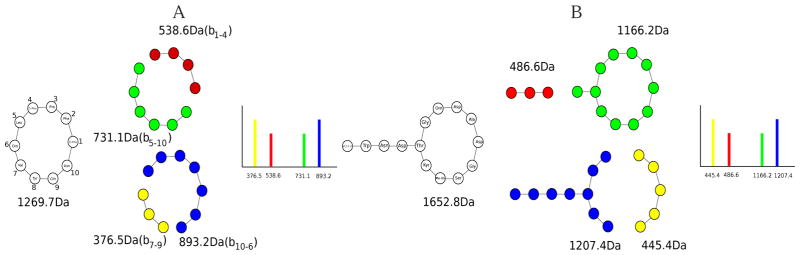
While nonlinear peptide natural products such as Vancomycin and Daptomycin are among the most effective antibiotics, the computational techniques for sequencing such peptides are still in their infancy. Previous methods for sequencing peptide natural products are based on Nuclear Magnetic Resonance spectroscopy and require large amounts (milligrams) of purified materials. Recently, development of mass spectrometry-based methods has enabled accurate sequencing of nonlinear peptide natural products using picograms of material, but the question of evaluating statistical significance of Peptide Spectrum Matches (PSM) for these peptides remains open. Moreover, it is unclear how to decide whether a given spectrum is produced by a linear, cyclic, or branch-cyclic peptide. Surprisingly, all previous mass spectrometry studies overlooked the fact that a very similar problem has been successfully addressed in particle physics in 1951. In this work, we develop a method for estimating statistical significance of PSMs defined by any peptide (including linear and nonlinear). This method enables us to identify whether a peptide is linear, cyclic, or branch-cyclic, an important step toward identification of peptide natural products.
Figures
Similar articles
-
Sequencing cyclic peptides by multistage mass spectrometry.Proteomics. 2011 Sep;11(18):3642-50. doi: 10.1002/pmic.201000697. Epub 2011 Aug 9. Proteomics. 2011. PMID: 21751357 Free PMC article.
-
Multiplex de novo sequencing of peptide antibiotics.J Comput Biol. 2011 Nov;18(11):1371-81. doi: 10.1089/cmb.2011.0158. Epub 2011 Oct 28. J Comput Biol. 2011. PMID: 22035290 Free PMC article.
-
The spectral networks paradigm in high throughput mass spectrometry.Mol Biosyst. 2012 Oct;8(10):2535-44. doi: 10.1039/c2mb25085c. Mol Biosyst. 2012. PMID: 22610447 Free PMC article. Review.
-
Assigning spectrum-specific P-values to protein identifications by mass spectrometry.Bioinformatics. 2011 Apr 15;27(8):1128-34. doi: 10.1093/bioinformatics/btr089. Epub 2011 Feb 23. Bioinformatics. 2011. PMID: 21349864 Free PMC article.
-
A survey of computational methods and error rate estimation procedures for peptide and protein identification in shotgun proteomics.J Proteomics. 2010 Oct 10;73(11):2092-123. doi: 10.1016/j.jprot.2010.08.009. Epub 2010 Sep 8. J Proteomics. 2010. PMID: 20816881 Free PMC article. Review.
Cited by
-
Automated genome mining of ribosomal peptide natural products.ACS Chem Biol. 2014 Jul 18;9(7):1545-51. doi: 10.1021/cb500199h. Epub 2014 May 23. ACS Chem Biol. 2014. PMID: 24802639 Free PMC article.
-
NRPquest: Coupling Mass Spectrometry and Genome Mining for Nonribosomal Peptide Discovery.J Nat Prod. 2014 Aug 22;77(8):1902-9. doi: 10.1021/np500370c. Epub 2014 Aug 12. J Nat Prod. 2014. PMID: 25116163 Free PMC article.
-
Dereplication of microbial metabolites through database search of mass spectra.Nat Commun. 2018 Oct 2;9(1):4035. doi: 10.1038/s41467-018-06082-8. Nat Commun. 2018. PMID: 30279420 Free PMC article.
-
Metabolomics and genomics in natural products research: complementary tools for targeting new chemical entities.Nat Prod Rep. 2021 Nov 17;38(11):2041-2065. doi: 10.1039/d1np00036e. Nat Prod Rep. 2021. PMID: 34787623 Free PMC article. Review.
-
Dereplication, sequencing and identification of peptidic natural products: from genome mining to peptidogenomics to spectral networks.Nat Prod Rep. 2016 Jan;33(1):73-86. doi: 10.1039/c5np00050e. Nat Prod Rep. 2016. PMID: 26497201 Free PMC article. Review.
References
-
- Li J, Vederas J. Drug discovery and natural products: end of an era or an endless frontier? Science. 2009;325:161–165. - PubMed
Publication types
MeSH terms
Substances
Grants and funding
LinkOut - more resources
Full Text Sources
Other Literature Sources
Miscellaneous
