. 2013 Apr;109(7):1969-78.
doi: 10.1152/jn.00039.2013. Epub 2013 Jan 23.

Extrasynaptic glutamate and inhibitory neurotransmission modulate ganglion cell participation during glutamatergic retinal waves

Affiliations

Extrasynaptic glutamate and inhibitory neurotransmission modulate ganglion cell participation during glutamatergic retinal waves

Alana Firl et al. J Neurophysiol. 2013 Apr.

Abstract

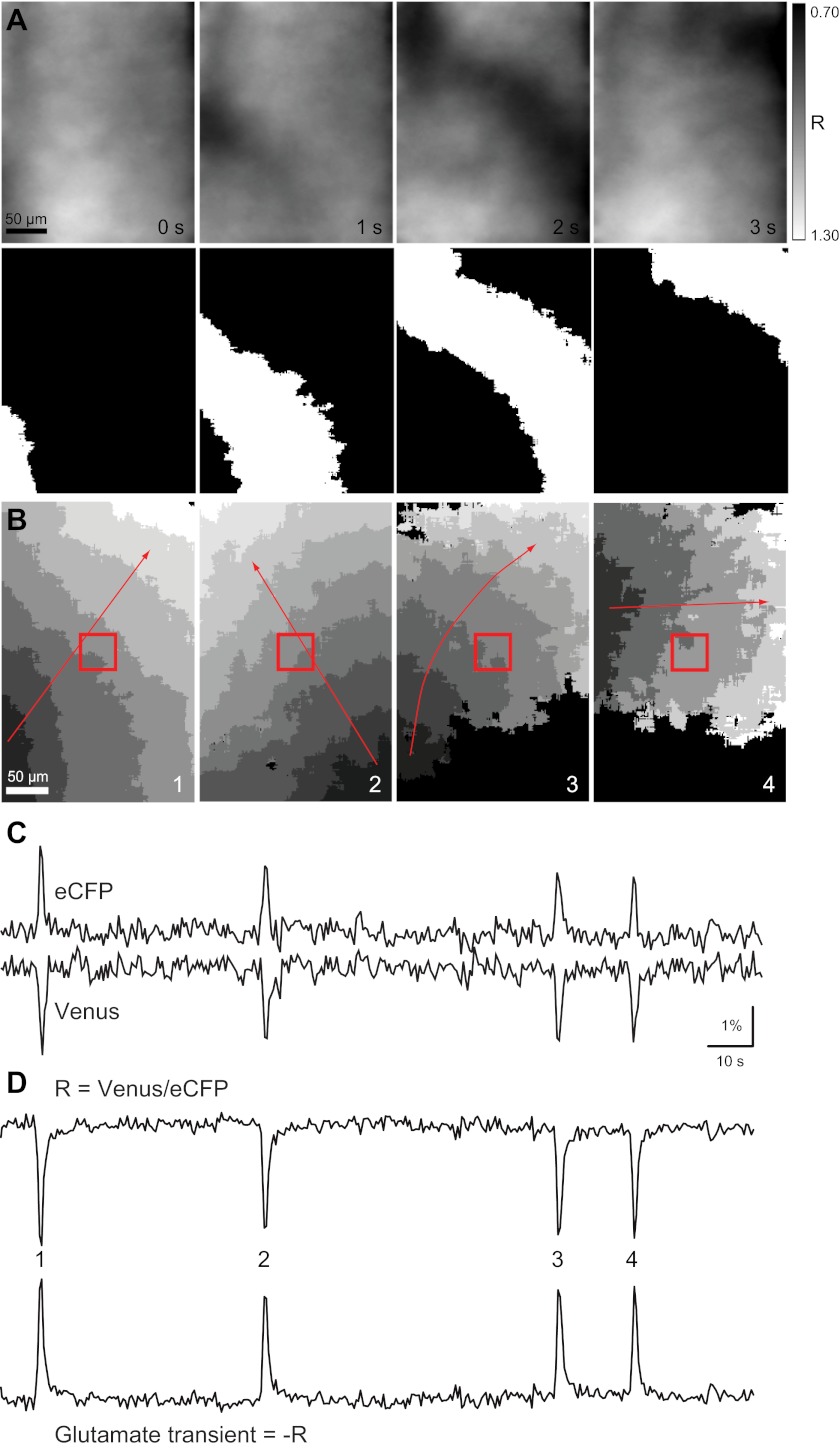
During the first 2 wk of mouse postnatal development, transient retinal circuits give rise to the spontaneous initiation and lateral propagation of depolarizations across the ganglion cell layer (GCL). Glutamatergic retinal waves occur during the second postnatal week, when GCL depolarizations are mediated by ionotropic glutamate receptors. Bipolar cells are the primary source of glutamate in the inner retina, indicating that the propagation of waves depends on their activation. Using the fluorescence resonance energy transfer-based optical sensor of glutamate FLII81E-1μ, we found that retinal waves are accompanied by a large transient increase in extrasynaptic glutamate throughout the inner plexiform layer. Using two-photon Ca(2+) imaging to record spontaneous Ca(2+) transients in large populations of cells, we found that despite this spatially diffuse source of depolarization, only a subset of neurons in the GCL and inner nuclear layer (INL) are robustly depolarized during retinal waves. Application of the glutamate transporter blocker dl-threo-β-benzyloxyaspartate (25 μM) led to a significant increase in cell participation in both layers, indicating that the concentration of extrasynaptic glutamate affects cell participation in both the INL and GCL. In contrast, blocking inhibitory transmission with the GABAA receptor antagonist gabazine and the glycine receptor antagonist strychnine increased cell participation in the GCL without significantly affecting the INL. These data indicate that during development, glutamate spillover provides a spatially diffuse source of depolarization, but that inhibitory circuits dictate which neurons within the GCL participate in retinal waves.


Figures

Fig. 1.
Fig. 1.
The fluorescence resonance energy transfer (FRET)-based glutamate sensor FLII81E-1μ detects coherent wave fronts of glutamate propagating through the inner plexiform layer (IPL) in postnatal day (P)10–P12 retinas. A: example of a single glutamate wave detected by FRET imaging of FLII81E-1μ in a P11 whole mount retina. The raw ratio data (top) and binarized version used for analysis (bottom) are shown. B: each image represents the spatial extent and duration of one glutamate transient. Within an image, each grayscale value represents the active area in one frame, with an imaging rate of 2 Hz. Dark gray is the first frame in which glutamate was detected, whereas white is the last. Black is baseline. Red arrows indicate the propagation direction. The red box is the area where ΔR/R was averaged to determine whether an increase in glutamate occurred in that region. C: example trace of raw fluorescence changes for enhance cyan fluorescent protein (eCFP) and Venus. D, top: resulting trace when the ratio of Venus to eCFP was taken. The downward peaks indicate the decrease in FRET when glutamate binds. Bottom, reflection of the top trace. The upward peaks indicate increases in glutamate. Numbered peaks correspond to the wave events shown in B.
Fig. 2.
Fig. 2.
Two-photon Ca2+ imaging reveals that neurons in the inner nuclear layer (INL) participate in glutamatergic retinal waves. A: example of wave propagation in the INL (top) and ganglion cell layer (GCL; bottom) observed with two-photon Ca2+ imaging at a frame rate of 1 Hz. Leftmost images are the retinal sample loaded with Oregon green BAPTA-1 AM (OGB). Circles are identified cells; black indicates cells with ΔF/F of >15% for the first time in that frame, and gray indicates cells with persisting ΔF/F above threshold. B: sample ΔF/F traces from averaged regions within cells. Each trace represents a different cell. C: raster plots of neuronal Ca2+ transients of >15% ΔF/F for all cells in the field of view. The total imaging duration was 5 min. D: histogram of interwave intervals for glutamate and Ca2+ imaging from both the GCL and INL (Ca2+ imaging: N = 150 wave intervals and FRET: N = 47 wave intervals).
Fig. 3.
Fig. 3.
Müller glial somas are not depolarized during retinal waves. A: P11 GLAST-tdTomato retina stained for anti-Chx10 showing the location of Müller glial and bipolar somas within the INL. The confocal image is of a vibratome section. Green is anti-Chx10, magenta is tdTomato, and blue is 4′,6-diamidino-2-phenylindole (DAPI). B: orthogonal projections of two-photon Z-stacks. The dashed line indicates the XY plane chosen for 1-Hz imaging. Left, GLAST-tdTomato labeling of Müller glial cells; right: bolus loading of OGB labeling both neurons and glial cells. C: XY plane from B, left. G and N indicate examples of Müller glial or neuronal somas, respectively. D: sample ΔF/F traces from averaged regions within identified neuronal or glial somas. E: raster plot of neuronal and glial Ca2+ transients of >15% ΔF/F.
Fig. 4.
Fig. 4.
dl-Threo-β-benzyloxyaspartate (TBOA) and gabazine (Gbz)/strychnine (Stry) increase wave frequency as detected by FLII81E-1μ and two-photon Ca2+ imaging of neurons in the INL and GCL. A: representative traces of glutamate transients for control (top), Gbz and Stry (middle) and TBOA (bottom). B: raster plots of neuronal Ca2+ transients detected by two-photon Ca2+ imaging as in Fig. 2C. C: cumulative distributions of interwave intervals for control (black), TBOA (gray), and Gbz/Str (blue) for FRET imaging in the IPL and Ca2+ imaging in the INL and GCL. Binning = 10 s. FRET glutamate transients: control, 47 wave intervals, 8 retinas; Gbz/Stry, 135 intervals, 5 retinas; and TBOA, 42 intervals, 5 retinas; Ca2+ INL: control, 84 intervals, 16 retinas; Gbz/Stry, 116 intervals, 8 retinas; and TBOA, 127 intervals, 8 retinas; and Ca2+ GCL: control, 156 intervals, 15 retinas; Gbz/Stry, 122 waves, 9 retinas; and TBOA, 42 intervals, 6 retinas. D: each image represents the spatial extent and duration of one glutamate transient in control (left), Gbz/Stry (middle left), and TBOA (middle right and right). Gray values correspond to the time during which that region of the retina was active, as in Fig. 1B. Red arrows indicate the propagation direction.
Fig. 5.
Fig. 5.
TBOA increases cell participation in the INL and GCL, whereas Gbz/Stry only increases GCL participation. A: cell participation in retinal waves. The INL (top) and GCL (bottom) in a whole mount retina loaded with OGB are shown. Magenta indicates cells that participated in at least one wave during the duration of the recording; open circles indicate cells that did not participate. The same field of view from an example retina was compared in control (left), Gbz/Stry (middle), and TBOA (right). B: changes in the proportion of waving cells. The change in the proportion of cells participating in at least one wave in the control versus drug condition were quantified for each retina, and these values were then averaged across all retinas (INL: TBOA, N = 8; Gbz/Stry, N = 8 and GCL: TBOA, N = 6; Gbz/Stry, N = 9). C: summary of effects of TBOA and Gbz/Stry on the average proportion of cells that participated per wave. Lines connect values of average cell participation per wave for one retina in control versus TBOA or Gbz/Stry in the INL and GCL. Open circles are group means and SD. See Table 1 for details.
Fig. 6.
Fig. 6.
The On-bipolar cell (BPC) blocker l-amino-4-phosphonobutyric acid (l-AP4) affects cell participation in glutamatergic waves. A,i: Grm6:eGFP-labeled On-BPCs (left) and bolus-loaded INL and GCL neurons (right). Top, orthogonal projections of two-photon Z-stacks. The dashed line indicates the XY plane chosen for 1-Hz imaging. Bottom, XY plane. Yellow arrows indicate On-BPCs. A,ii, top: sample ΔF/F traces from averaged regions within identified On-BPC somas. Bottom, raster plot of neuronal Ca2+ transients of >15% ΔF/F. Regions of interests 1–30 are identified On-BPCs; the remainder are unidentified neurons within the same imaging plane. On-BPCs stopped participating after the onset of l-AP4 washin (n = 5 retinas). aCSF, artificial cerebrospinal fluid. B: cell participation in retinal waves. The INL (top) and GCL (bottom) in a whole mount retina loaded with OGB are shown. Magenta indicates cells that participated in at least one wave during the duration of the recording; open circles indicate cells that did not participate. The same field of view from an example retina was compared in control (left) and l-AP4 (right). Red indicates increased activity compared with control; blue indicates decreased activity; magenta cells were unaffected. C: summary of effects of l-AP4 on the average proportion of cells that participated per wave. Lines connect values of average cell participation per wave for one retina in control versus l-AP4 in the INL and GCL. Open circles are group means and SD. See Table 1 for details.

Similar articles

Cited by

References

    1. Allene C, Cattani A, Ackman JB, Bonifazi P, Aniksztejn L, Ben-Ari Y, Cossart R. Sequential generation of two distinct synapse-driven network patterns in developing neocortex. J Neurosci 28: 12851–12863, 2008 - PMC - PubMed
    1. Awatramani G, Slaughter M. Intensity-dependent, rapid activation of presynaptic metabotropic glutamate receptors at a central synapse. J Neurosci 21: 741–749, 2001 - PMC - PubMed
    1. Bansal A, Singer JH, Hwang BJ, Xu W, Beaudet A, Feller MB. Mice lacking specific nicotinic acetylcholine receptor subunits exhibit dramatically altered spontaneous activity patterns, and reveal a limited role for retinal waves in forming O.N and OFF circuits in the inner retina. J Neurosci 20: 7672–7681, 2000 - PMC - PubMed
    1. Blankenship AG, Feller MB. Mechanisms underlying spontaneous patterned activity in developing neural circuits. Nat Rev Neurosci 11: 18–29, 2010 - PMC - PubMed
    1. Blankenship AG, Ford KJ, Johnson J, Seal RP, Edwards RH, Copenhagen DR, Feller MB. Synaptic and extrasynaptic factors governing glutamatergic retinal waves. Neuron 62: 230–241, 2009 - PMC - PubMed

Publication types

MeSH terms

LinkOut - more resources