Clinical Trial
. 2013 Apr;109(8):2192-204.
doi: 10.1152/jn.00368.2012. Epub 2013 Jan 23.

Somatosensory responses in a human motor cortex

Affiliations
Clinical Trial

Somatosensory responses in a human motor cortex

Ammar Shaikhouni et al. J Neurophysiol. 2013 Apr.

Abstract

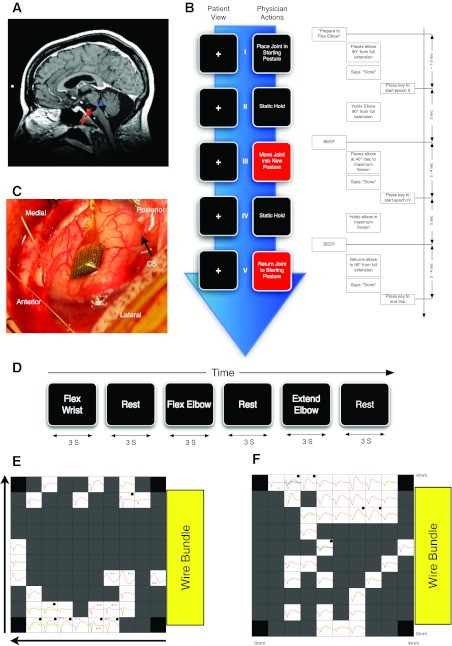
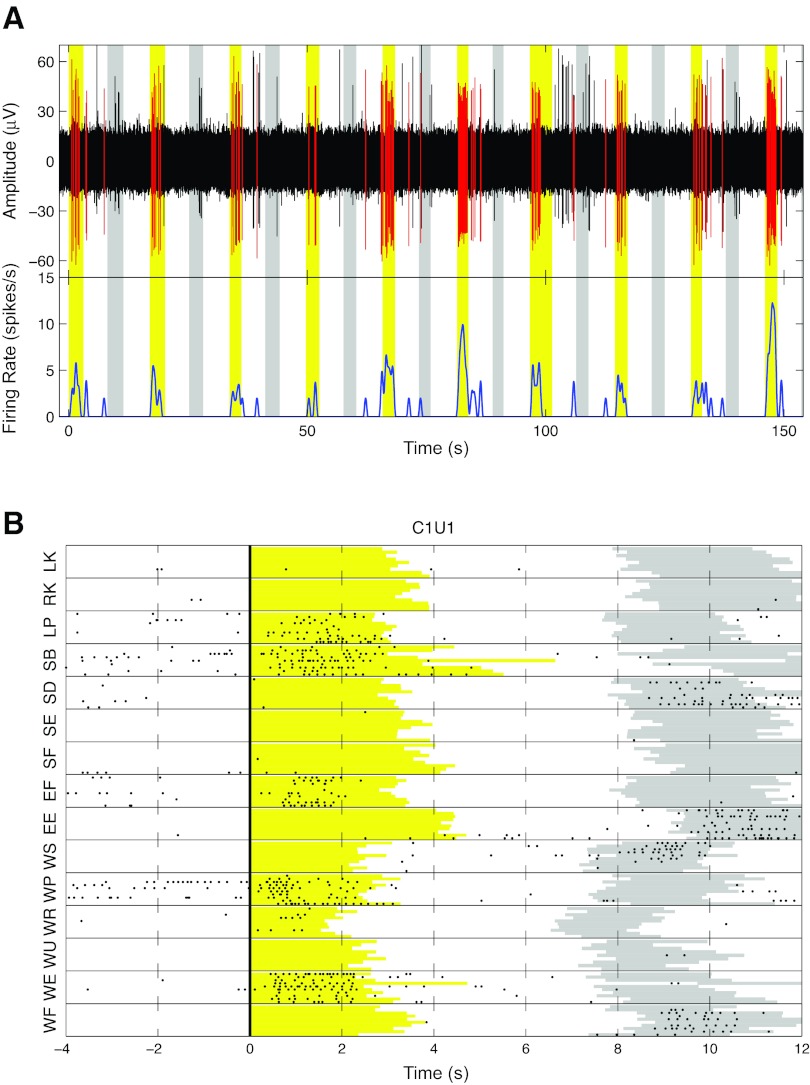
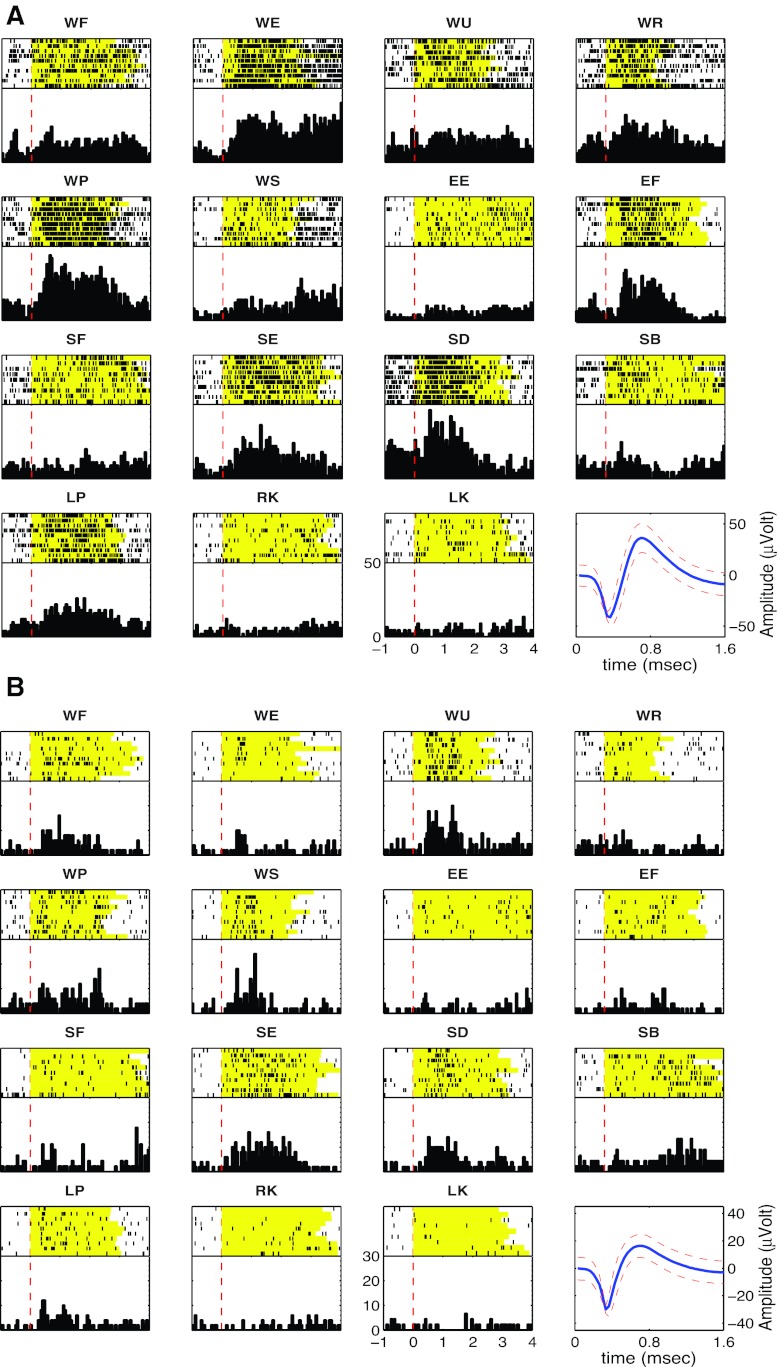
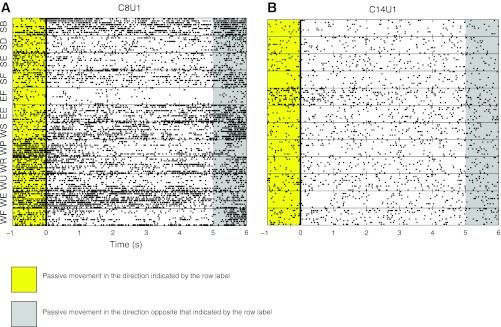
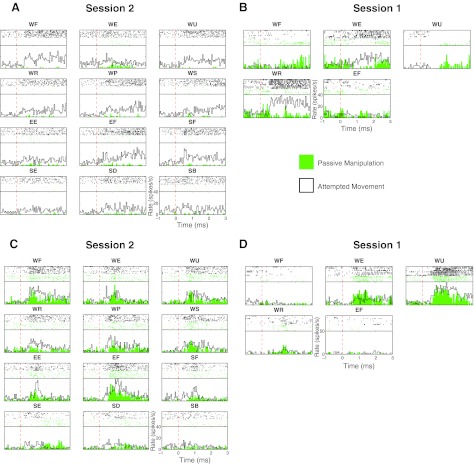
Somatic sensory signals provide a major source of feedback to motor cortex. Changes in somatosensory systems after stroke or injury could profoundly influence brain computer interfaces (BCI) being developed to create new output signals from motor cortex activity patterns. We had the unique opportunity to study the responses of hand/arm area neurons in primary motor cortex to passive joint manipulation in a person with a long-standing brain stem stroke but intact sensory pathways. Neurons responded to passive manipulation of the contralateral shoulder, elbow, or wrist as predicted from prior studies of intact primates. Thus fundamental properties and organization were preserved despite arm/hand paralysis and damage to cortical outputs. The same neurons were engaged by attempted arm actions. These results indicate that intact sensory pathways retain the potential to influence primary motor cortex firing rates years after cortical outputs are interrupted and may contribute to online decoding of motor intentions for BCI applications.


Figures

Fig. 1.
Fig. 1.
Methods. A: brain MRI before implantation showing location of lesion. The participant suffered a massive pontine stroke (red arrow) that affected most of the ventral descending tracts. The dorsal and lateral aspects of the pons where the spinal sensory pathways pass through that level of the pons were intact (blue arrowhead). B: timeline of 1 trial of the sensory manipulation task. The task was a block design with each block consisting of either 5 trials (session 1) or 10 trials (session 2) of 1 manipulation from the 15 different manipulations performed during the study. Arrow indicates passage of time. Left, the sequence of instructions relayed to the experimenter. Right, an exploded view of the timeline of 1 trial of elbow flexion block describing the auditory relay of instructions to the experimenter, the details of the experimenter performance of sensory manipulation, and the technician actions to mark the transitions between epochs of a trial. C: array placement during surgery (CS, central sulcus). D: details of attempted movement task as described in experimental procedures. E and F: maps of the average triggered waveforms on the array as viewed from above the cortical surface with the electrodes pointing down. Yellow box represents the position of the exit of the wire bundle. Horizontal arrow points in the anterior direction; vertical arrow points from lateral to medial. Each box represents the responses recorded from 1 electrode located at the corresponding spatial location. No electrodes were located at each of the 4 corners of the array, marked by black boxes. Dark gray boxes represent locations where an electrode was present but no waveforms could be isolated. On some channels, more than 1 unit was isolated and the average waveforms for those units are represented by different colors. All boxes have x-axis representing time with a range of 0 to 1.6 ms; the y-axis represents voltage. Two scales were used for the y-axis: boxes marked with a dot have a y-scale of ±100 μV; all other boxes have y-scales of ±50 μV. E shows data collected in session 1 (3/14/2007); in this session there were 3 cross-talk artifacts on channels labeled XT-1 through XT-3. F shows data collected in session 2 (3/19/2008).
Fig. 2.
Fig. 2.
Responses of 1 unit to passive joint manipulation. A, top: continuously recorded activity on 1 electrode filtered with a 4-pole Butterworth filter between 500 and 3,000 Hz to reveal spiking activity. Waveforms assigned to unit 1 on this channel are shown in red. Bottom, firing rate of the unit marked in red, calculated by convolving spike waveform with a hamming window 1 s long. Yellow rectangles mark the epochs during which the experimenter passively extended the wrist. Gray rectangles mark the epochs during which the joint was flexed back to its starting position. B: raster plot of the responses from the same unit. Each dot represents a detected action potential. Horizontal lines separate passive manipulation blocks. In each block a row represents 1 trial of the passive movement indicated on the vertical axis. All trials were aligned on the go cue delivered to the experimenter (thick vertical line). Yellow and gray regions represent movement epochs in the direction indicated on the vertical axis and back to starting position, respectively. Right-side manipulations: WF, wrist flexion; WE, wrist extension; WU, wrist ulnar deviation; WR, wrist radial deviation; WP, wrist pronation; WS, wrist supination; EF, elbow flexion; EE, elbow extension; SF, shoulder flexion; SE, shoulder extension; SD, shoulder adduction; SB, shoulder abduction; RK, right knee extension. Left-side manipulations (ipsilateral to array): LP, left wrist pronation; LK, left knee extension.
Fig. 3.
Fig. 3.
Example of rasters and peristimulus histograms (PSTH) from simultaneously recorded units with multiple joint responses to passive manipulation. The top part of each subpanel is a raster, with each row representing a trial and each dot representing a spike from the neuron. The yellow background indicates the duration of passive movement. Black dots represent discriminated spikes. All trials were centered at the time of auditory cue presentation to the experimenter (red dashed line). Bottom right subpanel shows the discriminated unit along with a confidence interval of 2 SD surrounding each amplitude time point of the waveform. A: unit (C8U1) shows responses to wrist, elbow, and shoulder. B: unit (C12U1) shows responses to wrist and shoulder only.
Fig. 4.
Fig. 4.
Example of units with static responses. Each horizontal block is a raster plot of neural activity from a block of 10 trials of the movement indicated on the y-axis. Each row in each block represents a passive movement trial. All rasters are centered on the time onset of the second hold epoch in which the joint was held at the extreme of the range of movement for that block. Yellow periods indicate passive movement in the direction indicated on the vertical axis. Gray periods indicate passive movement in the opposite direction. For example, in the WF block, the joint was flexed during the yellow period, held fully flexed during the following 5-s period (white background) that starts at the solid black line at time 0, and then returned to a neutral position during the gray period. A: C8U1 is an example of a unit with multijoint receptive fields. B: C14U1 had a single-joint receptive field. Both units were recorded in session 2.
Fig. 5.
Fig. 5.
Comparison of sensory and attempted movement responses. PSTH and rasters were calculated from passive joint manipulations (green) and attempted movement (black outline with no fill) of the same joint and same direction of the passive manipulation. The movement direction is indicated above each raster and PSTH. A: responses of a unit in session 2 (C42U1) that was unresponsive during passive manipulation but responded strongly to attempted movement. Each subpanel shows the result of 10 trials of each attempted and passive movement. B: responses from a unit (C75U1) in session 1 showing differential responses to passive and attempted movement. In this session only 5 movements were attempted, and there were only 5 trials of each passive movement and 8 trials of each attempted movements. C: responses of a unit in session 2 (C13U2). D: responses from a unit in session 1 (C83U2). Both the units in C and D show very similar responses to passive and attempted movement.

Similar articles

Cited by

References

    1. Albe-Fessard D, Liebeskind J. Origine des messages somatosensitifs activant les cellules du cortex moteur chez le singe. Exp Brain Res 1: 127–146, 1966 - PubMed
    1. Benjamini Y, Hochberg Y. Controlling the false discovery rate: a practical and powerful approach to multiple testing. J R Stat Soc Series B Methodol 57: 289–289, 1995
    1. Chadwick EK, Blana D, Simeral JD, Lambrecht J, Kim SP, Cornwell AS, Taylor DM, Hochberg LR, Donoghue JP, Kirsch RF. Continuous neuronal ensemble control of simulated arm reaching by a human with tetraplegia. J Neural Eng 8: 034003, 2011 - PMC - PubMed
    1. Cheney PD, Fetz EE. Corticomotoneuronal cells contribute to long-latency stretch reflexes in the rhesus monkey. J Physiol 349: 249–272, 1984 - PMC - PubMed
    1. Donoghue JP, Nurmikko A, Black M, Hochberg LR. Assistive technology and robotic control using motor cortex ensemble-based neural interface systems in humans with tetraplegia. J Physiol 579: 603–611, 2007 - PMC - PubMed

Publication types

LinkOut - more resources