. 2013 Apr 24;27(7):1091-8.
doi: 10.1097/QAD.0b013e32835f1ea1.

Deletion of podocyte STAT3 mitigates the entire spectrum of HIV-1-associated nephropathy

Affiliations

Deletion of podocyte STAT3 mitigates the entire spectrum of HIV-1-associated nephropathy

Leyi Gu et al. AIDS. .

Abstract

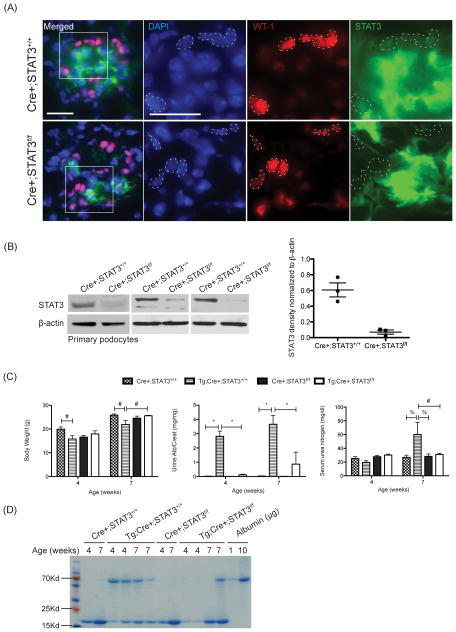
Objective: HIV-1 gene expression in kidney epithelial cells is thought to be responsible for the pathogenesis of HIV-1-associated nephropathy (HIVAN). Signal transducer and activator of transcription (STAT) 3 signaling is activated in podocytes of patients with HIVAN and drives the dedifferentiation and proliferation of podocytes in culture. We confirm here that deletion of podocyte STAT3 is sufficient to mitigate the glomerular as well as tubulointerstitial findings of HIVAN.

Methods: To demonstrate the functional role of podocyte STAT3 in the pathogenesis of HIVAN we compared the development of HIVAN in Tg26 HIV-transgenic mice with and without deletion of STAT3 in the podocyte.

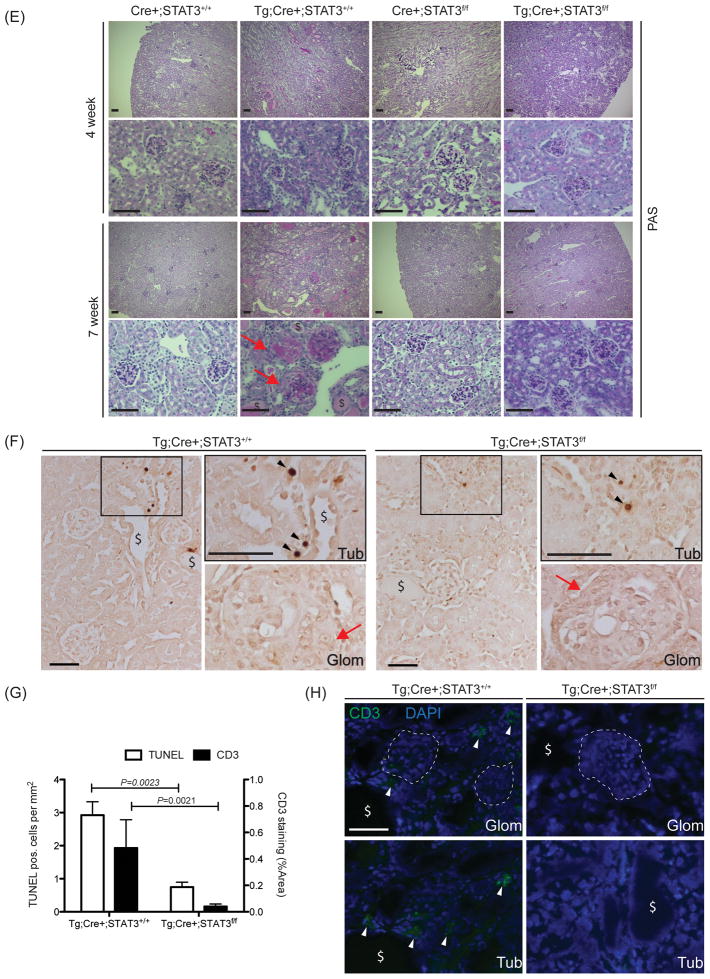
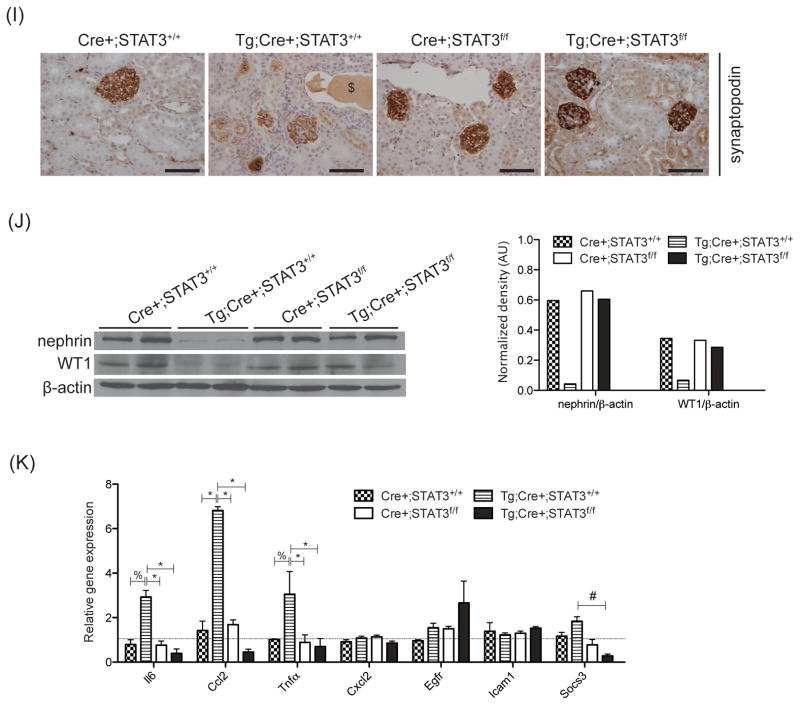
Results: Tg26 mice with podocyte-specific STAT3 deletion developed significantly less weight loss, albuminuria, and renal function impairment compared to Tg26 mice without STAT3 deletion. Tg26 mice with podocyte STAT3 deletion also had significantly less glomerular collapse, sclerosis, epithelial cell hyperplasia, podocyte dedifferentiation, and proinflammatory STAT3 target gene expression; and tubulointerstitial changes of HIVAN, including tubular atrophy, degeneration, apoptosis, and lymphocyte infiltration, were also significantly reduced compared to Tg26 mice without STAT3 deletion.

Conclusion: Development of glomerular as well as tubulointerstitial injuries in the Tg26 HIVAN model is dependent on podocyte STAT3 expression. Inhibition of STAT3 could be a potential adjunctive therapy for the treatment of HIVAN.


Conflict of interest statement

Statement of competing financial interests

The authors have no competing financial interests.

Figures

Figure 1
Figure 1. Renal phenotype of Tg26 mice with or without podocyte-specific STAT3 deletion
(A) STAT3 and Wilms Tumor 1 (WT-1) staining: representative images of STAT3 and WT-1 co-labeling in glomeruli of Cre+;STAT3+/+ and Cre+;STAT3f/f mice. Magnified views of the area circumscribed by the white box in the Merged image are displayed in separate channels corresponding to DAPI (4′,6-diamidino-2-phenylindole), WT-1, and STAT3. White dashed lines outline the WT-1 positive areas. (B) Podocyte STAT3 western blots: Western blots and a graph of normalized band densitometric values. (C) Body weight, urine albumin to creatinine ratio, and serum urea nitrogen concentration: Values at 4 and 7 weeks of age. n=4 mice/group. (D) Coomasie blue staining of representative urine samples from either 4 or 7 week-old mice. Each lane contains a sample from a different mouse. Albumin protein standards (1 and 10 μg/lane) were added to verify the identity of the 70kD band. (E) Period Acid Schiff staining: representative images of kidney sections of 4 and 7 week-old mice. (F) Representative images of TUNEL staining for 7 week-old mice: Magnified images of the tubular region (Tub) circumscribed by the black-line box contain TUNEL positive cells (black arrowheads). Glomeruli (Glom) with epithelial cell hyperplasia (Red arrows) do not have TUNEL staining. (G) A graph summarizing TUNEL and CD3 staining results for 7 week-old mice. (H) Images of CD3 staining (green; white arrowheads). Tubular (Tub) and glomerular (Glom) areas are shown. (I) Synaptopodin staining in 7 week-old mice. (J) Left panel: Western blots of nephrin, Wilm’s tumor 1 (WT1), and β-actin of total kidney lysates from two 7 week-old mice of each genotype. Right panel: Normalized band densitometric values for the western blots in the left panel. AU: arbitrary unit. (K) Relative expression of STAT3 target genes in glomeruli of 7 week-old mice of different genotypes (n=4 per group). Il6, interleukin 6; Ccl2, chemokine C-C motif ligand 2; Tnfα, tumor necrosis factor α; Cxcl2, C-X-C motif ligand 2; Egfr, epidermal growth factor receptor; Icam1, intercellular adhesion molecule 1; Socs3, suppressor of cytokine signaling 3. %P<0.01, *P<0.001, #P<0.05, Scale bar: 20μm. Red arrows: Glomerular epithelial cell hyperplasia. $: Dilated tubules with and without tubular proteinaceous cast.

Similar articles

Cited by

References

    1. D’Agati V, Appel GB. HIV infection and the kidney. J Am Soc Nephrol. 1997;8:138–152. - PubMed
    1. Wyatt CM, Klotman PE, D’Agati VD. HIV-associated nephropathy: clinical presentation, pathology, and epidemiology in the era of antiretroviral therapy. Semin Nephrol. 2008;28:513–522. - PMC - PubMed
    1. Peters PJ, Moore DM, Mermin J, Brooks JT, Downing R, Were W, et al. Antiretroviral therapy improves renal function among HIV-infected Ugandans. Kidney Int. 2008;74:925–929. - PubMed
    1. Wyatt CM, Meliambro K, Klotman PE. Recent progress in HIV-associated nephropathy. Annu Rev Med. 2012;63:147–159. - PubMed
    1. Leventhal JS, Ross MJ. Pathogenesis of HIV-associated nephropathy. Semin Nephrol. 2008;28:523–534. - PubMed

Publication types

MeSH terms