. 2013 Jun;7(6):1139-49.
doi: 10.1038/ismej.2012.175. Epub 2013 Jan 24.

Genomic island genes in a coastal marine Synechococcus strain confer enhanced tolerance to copper and oxidative stress

Affiliations

Genomic island genes in a coastal marine Synechococcus strain confer enhanced tolerance to copper and oxidative stress

Rhona K Stuart et al. ISME J. 2013 Jun.

Abstract

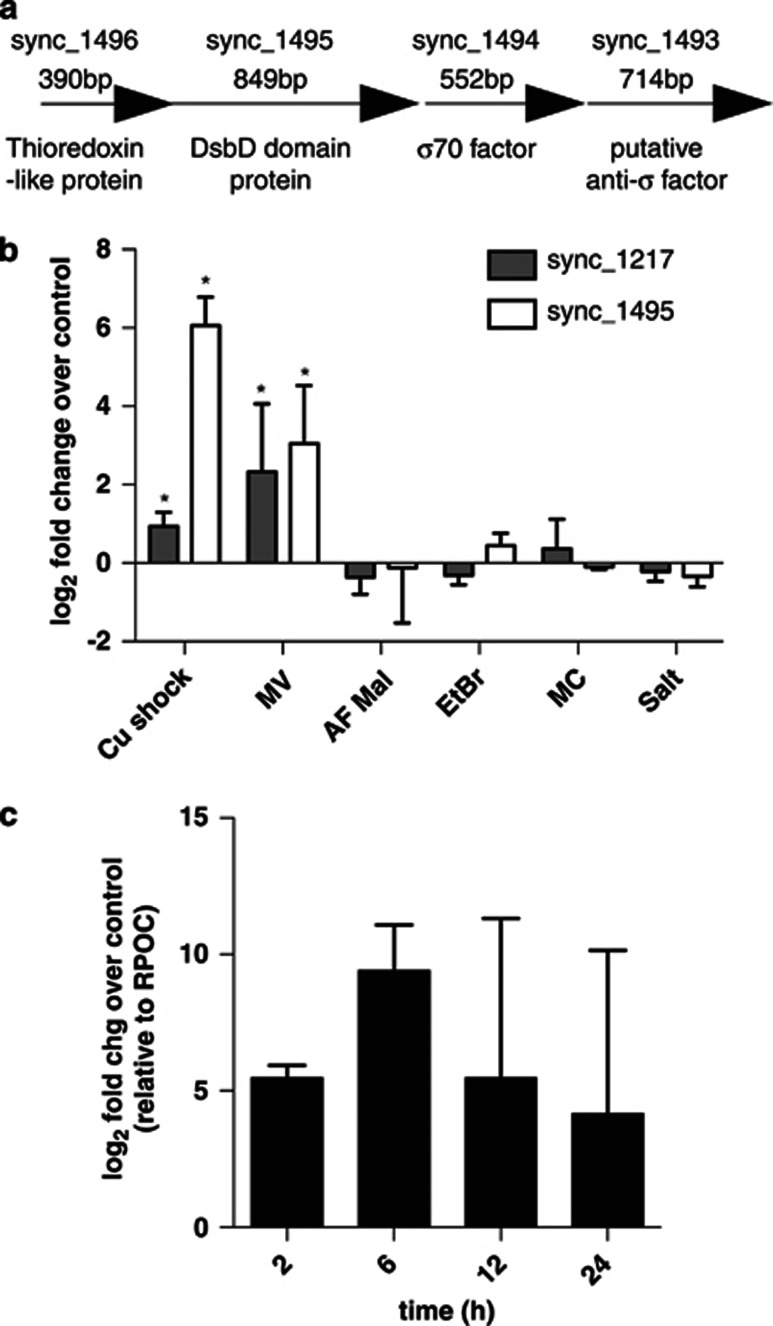
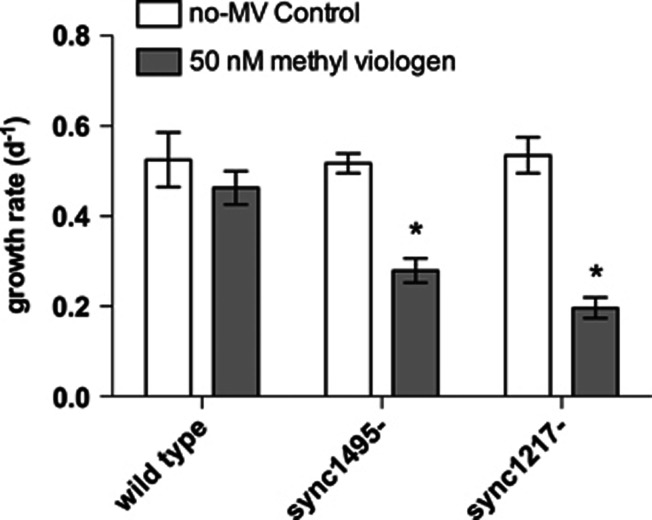
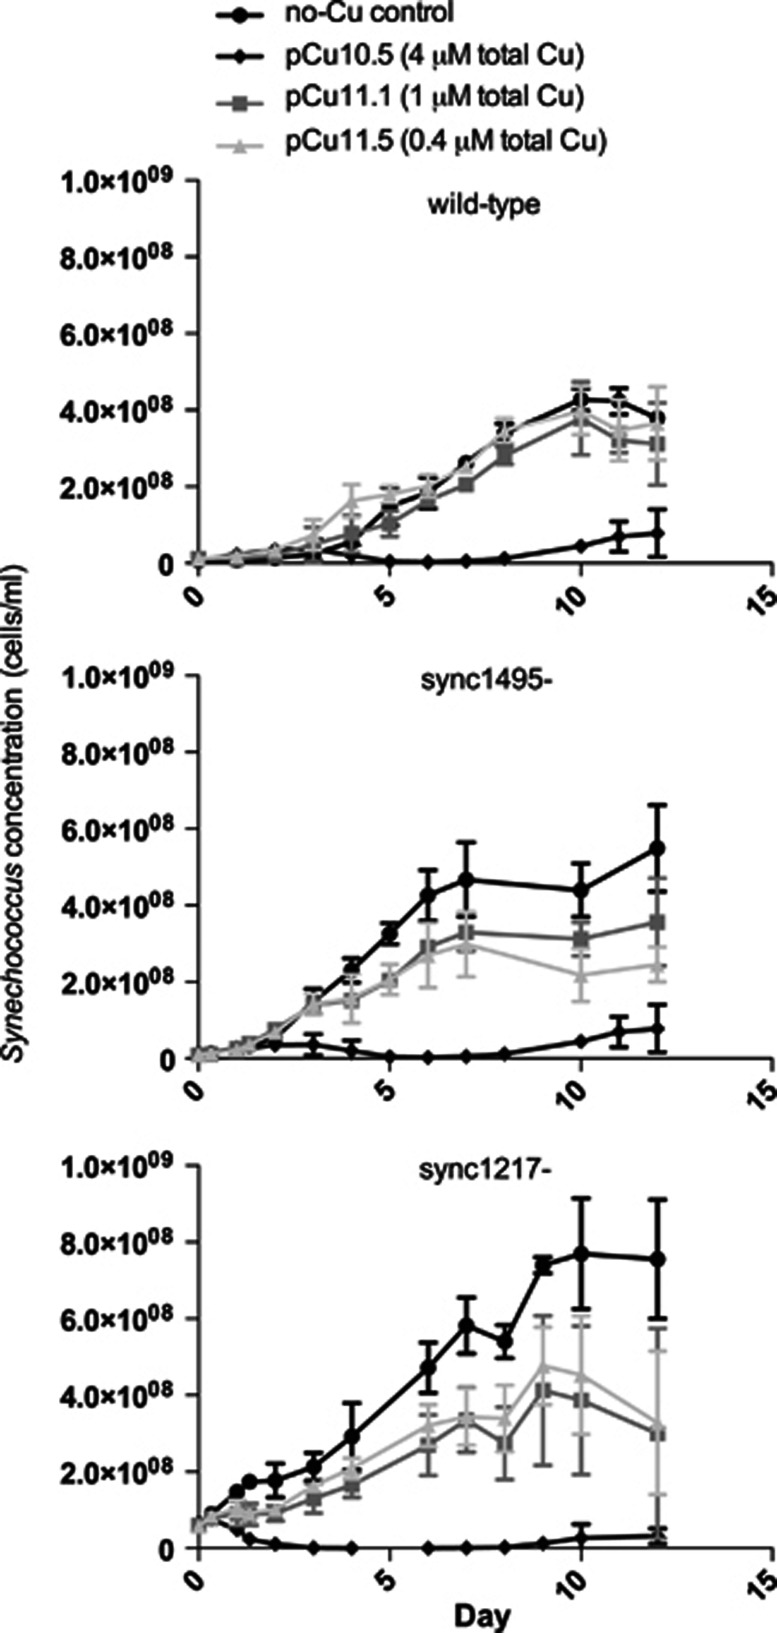
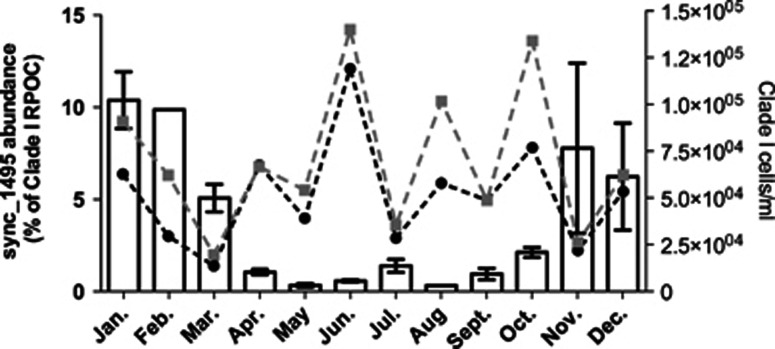
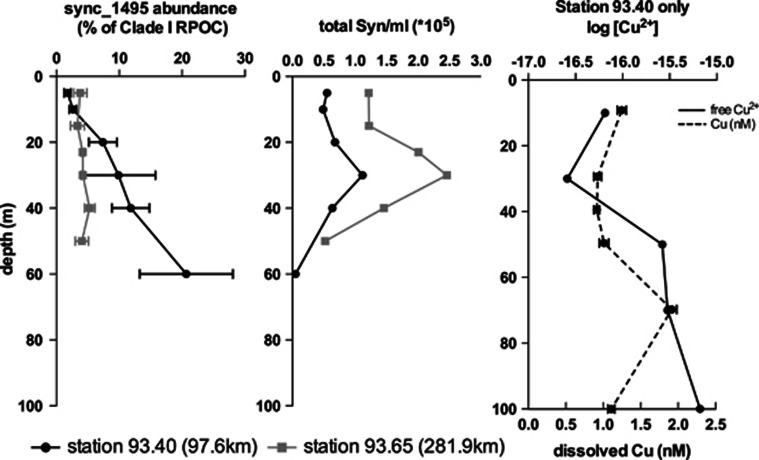
Highly variable regions called genomic islands are found in the genomes of marine picocyanobacteria, and have been predicted to be involved in niche adaptation and the ecological success of these microbes. These picocyanobacteria are typically highly sensitive to copper stress and thus, increased copper tolerance could confer a selective advantage under some conditions seen in the marine environment. Through targeted gene inactivation of genomic island genes that were known to be upregulated in response to copper stress in Synechococcus sp. strain CC9311, we found two genes (sync_1495 and sync_1217) conferred tolerance to both methyl viologen and copper stress in culture. The prevalence of one gene, sync_1495, was then investigated in natural samples, and had a predictable temporal variability in abundance at a coastal monitoring site with higher abundance in winter months. Together, this shows that genomic island genes can confer an adaptive advantage to specific stresses in marine Synechococcus, and may help structure their population diversity.


Figures

Figure 1
Figure 1
Sync_1495 gene expression in response to stressors and over time. (a) is a schematic of the operon sync_1496−1493. (b) is gene expression in response to various stressors. Log2 fold change is calculated relative to a control treatment. Error bars represent one s.d. between three biological replicates. ‘Cu' is quantitative reverse transcription (RT)-PCR after 2 h of copper addition (pCu10.1, 10 μℳ CuEDTA), ‘MV' is qRT-PCR of methyl viologen treatment 2 h after addition (100 nℳ). ‘AF Mal' is qRT-PCR AlexaFluor-488 C5 maleimide 2 h after addition (1 μℳ). ‘EtBR', ‘MC' and ‘salt' are microarray expression data (S Tetu, D Johnson, K Phillippy, R Stuart, C Dupont, K Hassan, B Palenik and I Paulsen, unpublished data). (c) is gene expression of sync_1495 over 24 h after copper stress (pCu10.1, 10 μℳ CuEDTA).
Figure 2
Figure 2
Synechococcus CC9311 wild type and mutant methyl viologen growth assays. Growth rates in both wild-type CC9311 (‘wt'), sync1495- and sync1217-. Cells per ml from flow cytometry counts were ln-transformed and a linear regression was performed on each. Bars represent linear regression slope, error bars represent one s.d. between three biological replicates. Star indicates significant difference from no-MV control treatment (one sample t-test, P<0.05).
Figure 3
Figure 3
Synechococcus CC9311 wild type and mutant copper growth assays. Wild-type CC9311 (‘wt'), sync1495- and sync1217- cells per ml from flow cytometry counts. Error bars represent one s.d. between three biological replicates. Cells/ml do not take into account mean cell size, which was significantly smaller in sync1217- (see Supplementary Figure S3).
Figure 4
Figure 4
Temporal distribution of sync_1495 gene over 2 years off the Scripps Institution of Oceanography pier. Bars show qPCR of sync_1495 as a percentage of total Clade I Synechococcus abundance (as determined by Clade I rpoc1 abundance) in surface samples from 2005 and 2007. Error bars represent +/− one s.e.m. between 2 replicate years (2005 and 2007). For Feb. and Aug. months no data was available for 2005 and only 2007 value is shown. Lines show Synechococcus abundance data from Tai et al., 2009; black line shows Clade I total abundance from qPCR and gray line shows total Synechococcus numbers from flow cytometry.
Figure 5
Figure 5
Spatial distribution of sync_1495 gene from two stations in the Southern California Bight. Numbers in parentheses indicate distance from shore. Left vertical profile shows qPCR of sync_1495 as a percentage of total Clade I Synechococcus abundance (as determined by Clade I rpoc1 abundance). Error bars represent one s.d. between three technical replicates. Middle profile shows Synechococcus counts from flow cytometry taken from Tai et al., 2011. Right profile shows both total dissolved copper concentration (dashed line) and free copper (-log[Cu2+]) concentrations (solid line). -log[Cu2+] measurements from copper speciation using CLE-ACSV at 25 μℳ SA (Buck et al., 2010).

Similar articles

Cited by

References

    1. Avrani S, Wurtzel O, Sharon I, Sorek R, Lindell D. Genomic island variability facilitates Prochlorococcus-virus coexistence. Nature. 2011;474:604–608. - PubMed
    1. Baron M, Arellano JB, Gorge JL. Copper and photosystem-II - A controversial relationship. Physiol Plant. 1995;94:174–180.
    1. Blake AC, Chadwick DB, Zirino A, Rivera-Duarte I. Spatial and temporal variations in copper speciation in San Diego Bay. Estuaries. 2004;27:437–447.
    1. Brahamsha B. A genetic manipulation system for oceanic cyanobacteria of the genus. Synechococcus. Appl Environ Microbiol. 1996a;62:1747–1751. - PMC - PubMed
    1. Brahamsha B. An abundant cell-surface polypeptide is required for swimming by the nonflagellated marine cyanobacterium. Synechococcus.Proc Natl Acad Sci USA. 1996b;93:6504–6509. - PMC - PubMed

Publication types