

Adrenal gland abnormality detection using random forest classification
- PMID: 23344259
- PMCID: PMC3782594
- DOI: 10.1007/s10278-012-9554-7
Adrenal gland abnormality detection using random forest classification
Abstract
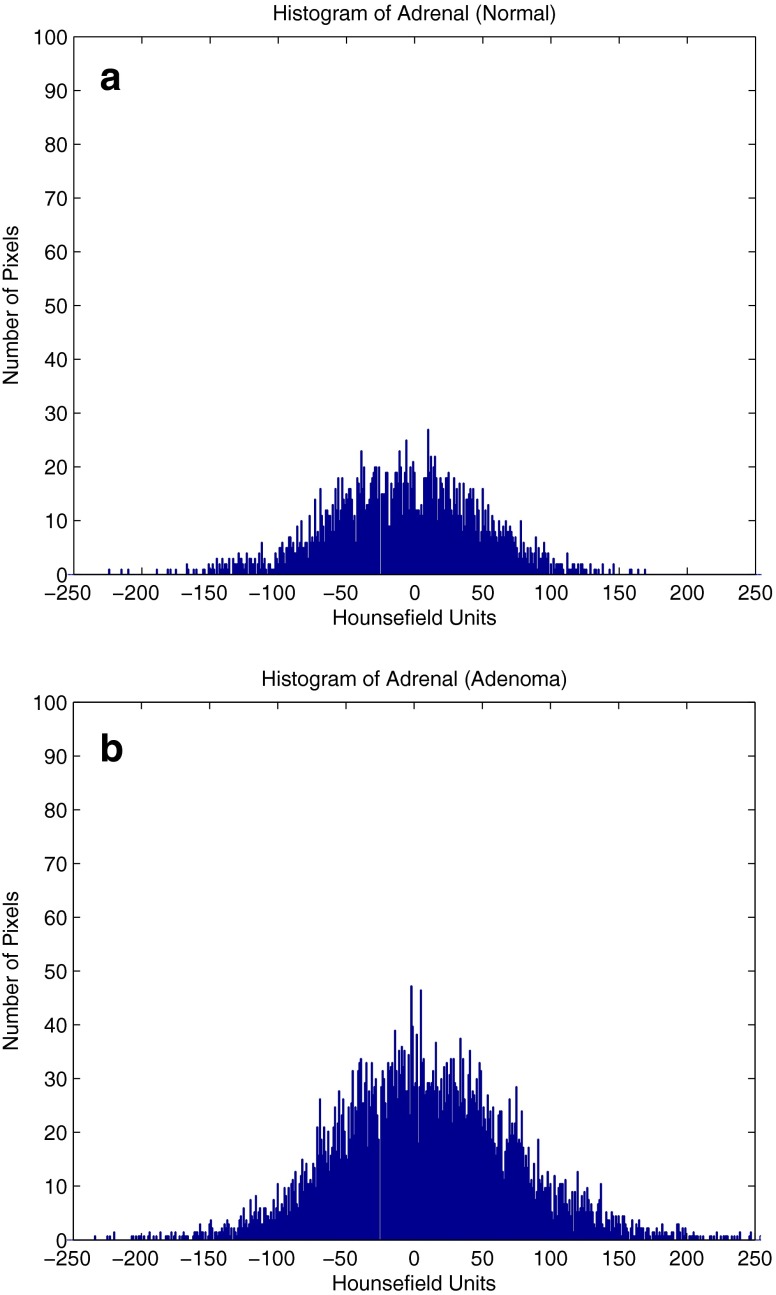
Adrenal abnormalities are commonly identified on computed tomography (CT) and are seen in at least 5 % of CT examinations of the thorax and abdomen. Previous studies have suggested that evaluation of Hounsfield units within a region of interest or a histogram analysis of a region of interest can be used to determine the likelihood that an adrenal gland is abnormal. However, the selection of a region of interest can be arbitrary and operator dependent. We hypothesize that segmenting the entire adrenal gland automatically without any human intervention and then performing a histogram analysis can accurately detect adrenal abnormality. We use the random forest classification framework to automatically perform a pixel-wise classification of an entire CT volume (abdomen and pelvis) into three classes namely right adrenal, left adrenal, and background. Once we obtain this classification, we perform histogram analysis to detect adrenal abnormality. The combination of these methods resulted in a sensitivity and specificity of 80 and 90 %, respectively, when analyzing 20 adrenal glands seen on volumetric CT datasets for abnormality.
Figures


References
-
- Mayo-Smith WW, Boland GW, Noto RB, Lee MJ. State-of-the-art adrenal imaging. Radiographics. 2001;21(4):995–1012. - PubMed
-
- Peña CS, Boland GW, Hahn PF, Lee MJ, Mueller PR. Characterization of indeterminate (lipid-poor) adrenal masses: use of washout characteristics at contrast-enhanced CT. Radiology. 2000;211(3):629–636. - PubMed
-
- “Radiology Associates.” [Online]. Available: http://www.rasloimaging.com/for_physcians/Master Schedules/Newsletters/Feb.2012 Newsletter.pdf. Accessed 10 May 2012.
-
- Yao C, Wada T, Shimizu A, Kobatake H, Nawano S. Simultaneous location detection of multi-organ by atlas-guided eigen-organ method in volumetric medical images. Int J CARS. 2006;1:42–44.
MeSH terms
LinkOut - more resources
Full Text Sources
Other Literature Sources
