. 2013 Feb 15;19(4):809-20.
doi: 10.1158/1078-0432.CCR-12-2736. Epub 2013 Jan 23.

Identification of FGFR4 as a potential therapeutic target for advanced-stage, high-grade serous ovarian cancer

Affiliations

Identification of FGFR4 as a potential therapeutic target for advanced-stage, high-grade serous ovarian cancer

Tarrik M Zaid et al. Clin Cancer Res. .

Abstract

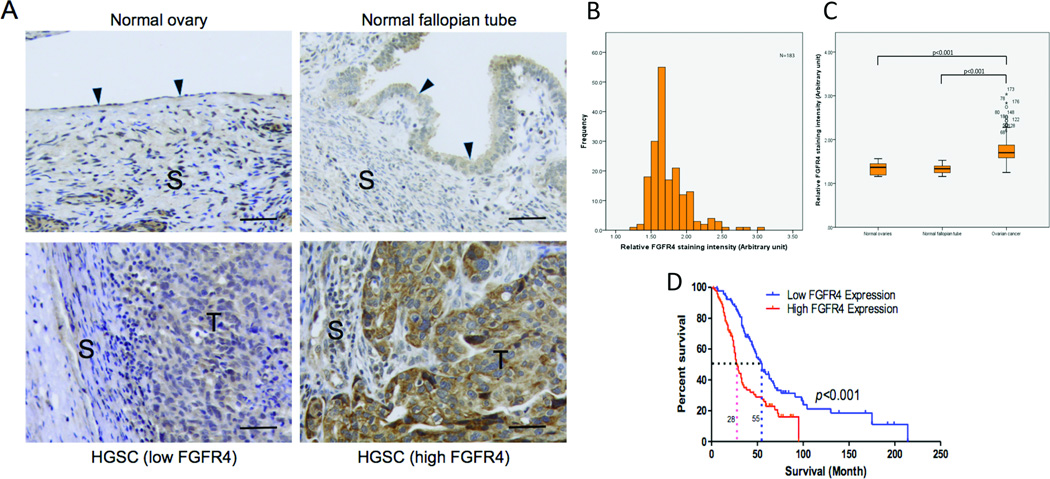
Purpose: To evaluate the prognostic value of fibroblast growth factor receptor 4 (FGFR4) protein expression in patients with advanced-stage, high-grade serous ovarian cancer, delineate the functional role of FGFR4 in ovarian cancer progression, and evaluate the feasibility of targeting FGFR4 in serous ovarian cancer treatment.

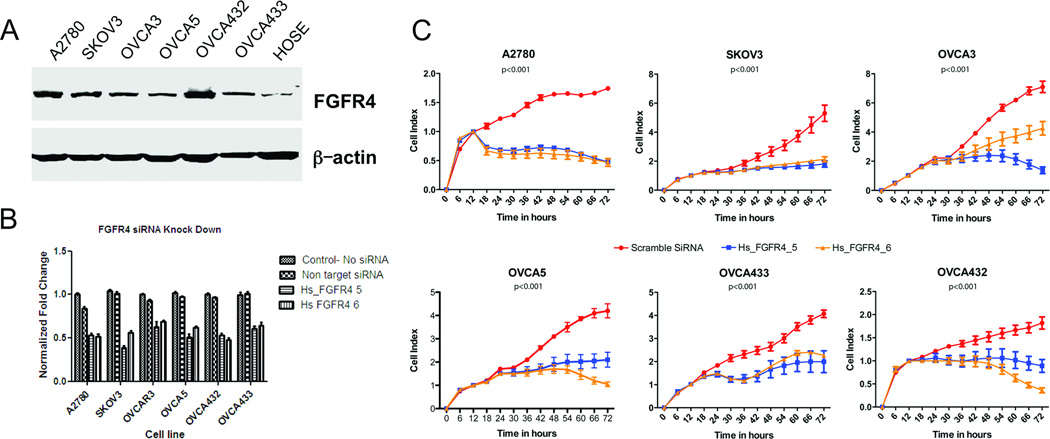
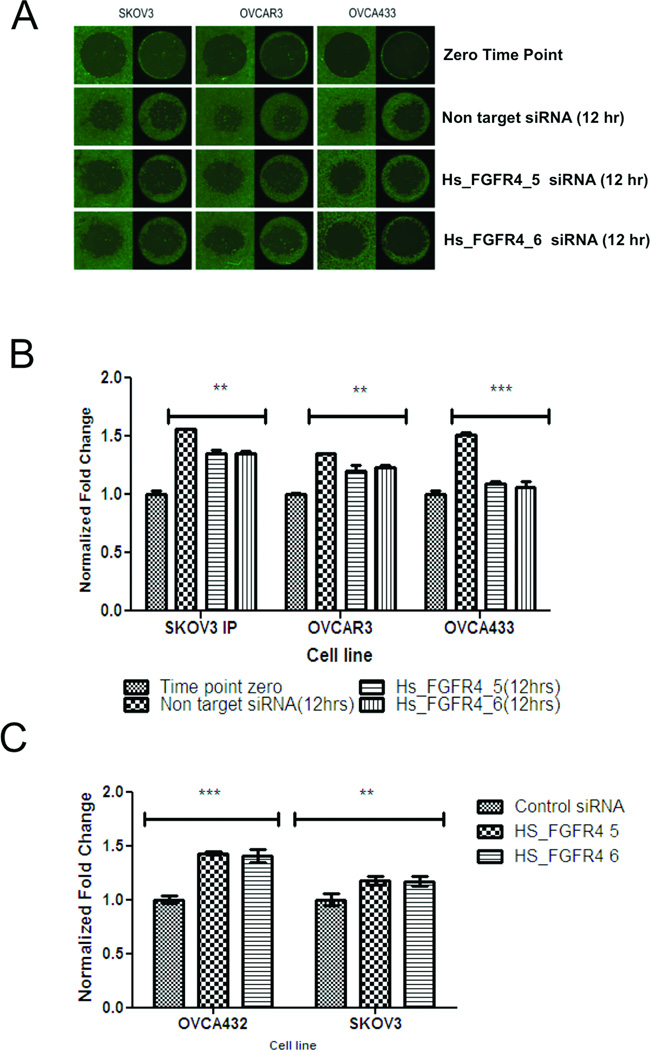
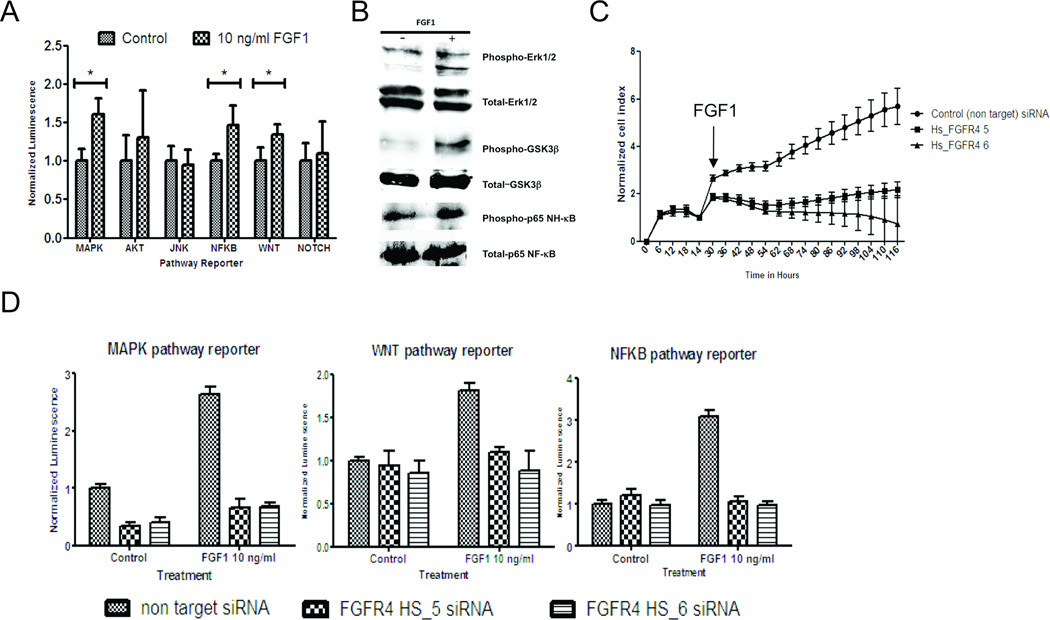
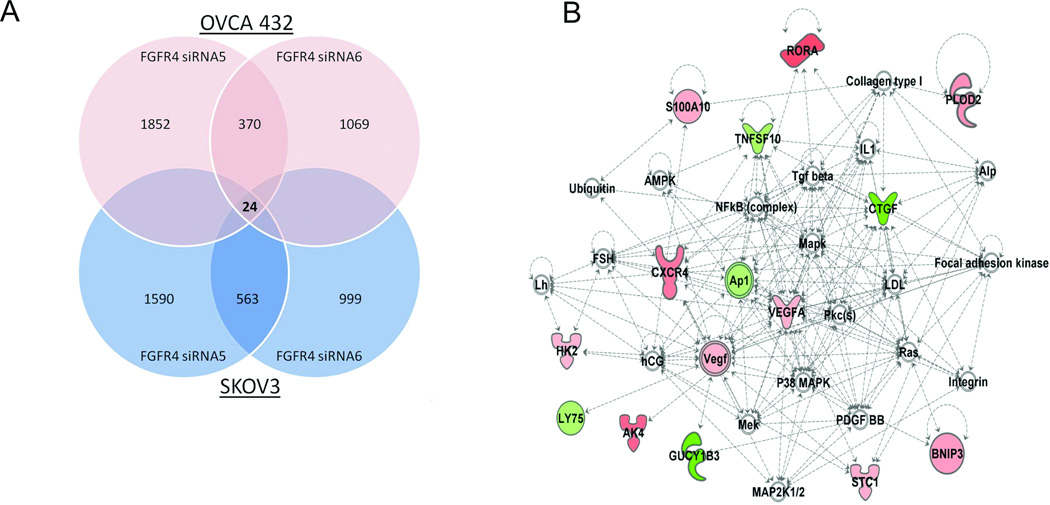
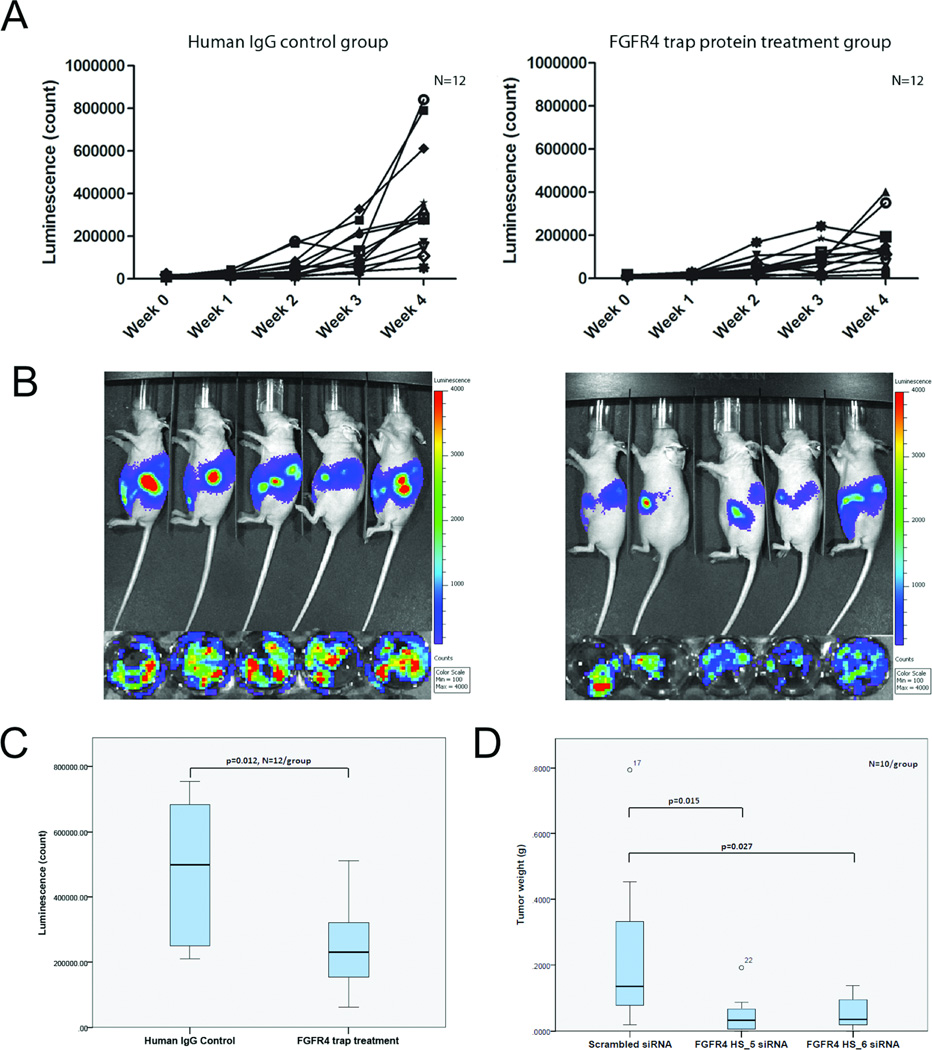
Experimental design: Immunolocalization of FGFR4 was conducted on 183 ovarian tumor samples. The collected FGFR4 expression data were correlated with overall survival using Kaplan-Meier and Cox regression analyses. The effects of FGFR4 silencing on ovarian cancer cell growth, survival, invasiveness, apoptosis, and FGF1-mediated signaling pathway activation were evaluated by transfecting cells with FGFR4-specific siRNAs. An orthotopic mouse model was used to evaluate the effect of injection of FGFR4-specific siRNAs and FGFR4 trap protein encapsulated in nanoliposomes on ovarian tumor growth in vivo.

Results: Overexpression of FGFR4 protein was significantly associated with decreased overall survival durations. FGFR4 silencing significantly decreased the proliferation, survival, and invasiveness and increased apoptosis of ovarian cancer cells. Also, downregulation of FGFR4 significantly abrogated the mitogen-activated protein kinase (MAPK), nuclear factor-κB (NF-κB), and WNT signaling pathways, which are activated by FGF1. Targeting FGFR4 with the FGFR4-specific siRNAs and FGFR4 trap protein significantly decreased ovarian tumor growth in vivo.

Conclusions: FGFR4 is a prognostic marker for advanced-stage, high-grade serous ovarian carcinoma. Silencing FGFR4 and inhibiting ligand-receptor binding significantly decrease ovarian tumor growth both in vitro and in vivo, suggesting that targeting ovarian cancer cells with high levels of FGFR4 protein expression is a new therapeutic modality for this disease and will improve survival of it.


Conflict of interest statement

Disclosure of Potential Conflicts of Interest

No potential conflicts of interest were disclosed.

Figures

Figure 1
Figure 1
Overexpression of FGFR4 protein is associated with overall survival. (A) Immunolocalization of FGFR4 demonstrating low FGFR4 protein expression in normal ovarian and fallopian tube tissue samples and low and high FGFR4 expression in an advanced-stage, high-grade serous ovarian carcinoma sample. S, stroma; T, tumor cells; bar = 10 µg. (B) Histogram showing the distribution of FGFR4 signaling intensity in the 183 high-grade serous ovarian carcinoma samples used in the survival analysis. (C) Box plot showing significantly higher FGFR4 protein expression in high-grade serous ovarian tumor samples than in normal ovarian and fallopian tube tissue samples. The bottom of the box indicates the 25th percentile, the top indicates the 75th percentile, and the whiskers represent 95% confidence intervals. (D) Kaplan-Meier analysis of the 183 study patients with advanced-stage, high-grade serous ovarian carcinoma showing a significant correlation between FGFR4 protein expression and overall survival with use of the median FGFR4 staining intensity as the cutoff (log rank test; P < 0.001). The median survival in the high FGFR4 expression group was 24 months, whereas that in the low expression group was 55 months. Correlation of FGFR4 protein expression with survival was maintained after stratification according to age and debulking status.
Figure 2
Figure 2
FGFR4 silencing in vitro decreases ovarian cancer cell survival and proliferation. (A) Western blot analysis showing higher levels of FGFR4 expression in the ovarian cancer cell lines A2780, SKOV3, OVCA3, OVCA5, OVCA432, and OVCA433 than in the normal ovarian epithelial cell. Fifty micrograms of protein was loaded in each lane. The same blot was probed with an anti-β-actin antibody for the normalization of protein loading and transfer. (B) Bar charts showing the survival of high-grade serous ovarian cancer cell lines after transfection with Hs_FGFR4_5 and Hs_FGFR4_6 and with the nontarget scrambled siRNA and incubation for 72 hours in serum-reduced media. Cells transfected with the FGFR4-specific siRNAs had significantly decreased survival than did those transfected with the control siRNA as measured using WST-1 assays (P < 0.001). (C) Real-time cell proliferation assay using electric impedence as a measure of ovarian cancer cell proliferation. Electrical impedance was normalized according to background measurement at time point 0. Results demonstrated a significantly lower rate of proliferation of high-grade serous ovarian carcinoma cells transiently transfected with Hs_FGFR4_5 and Hs_FGFR4_6 than of cells transfected with the nontarget scrambled siRNA (P < 0.001).
Figure 3
Figure 3
FGFR4 silencing decreases ovarian cancer cell invasion potential in vitro. (A) Fluorescent micrographs showing SKOV3, OVCA3, and OVCA433 cells transiently transfected with Hs_FGFR4_5 and Hs_FGFR4_6 and the nontarget scrambled siRNA invading into the central zone of the Oris assay at 0 and 12 hours. Cells were then stained with calcein AM for visualization. (B) Bar charts showing significantly lower invasion potential of SKOV3, OVCA3, and OVCA433 cells after transfection with FGFR4-specific siRNAs than of control cells. *P = 0.024; **P = 0.003; ***P = 0.001. Error bars represent standard errors of the mean. (C) Bar chart showing significantly higher apoptosis rates in response to serum starvation as measured according to increased number of cell-free nucleosomes in SKOV3 and OVCA432 cells after transfection with FGFR4-specific siRNAs than in the control cells. **P < 0.01; ***P < 0.001. Error bars represent standard errors of the mean.
Figure 4
Figure 4
FGFR4 silencing abrogates the effect of FGF1 on ovarian cancer cell growth and downstream signaling pathway activation. (A) Bar chart showing a significant increase in reporter activity in FGF1-treated OVCA432 cells stably transfected with the Cignal lenti reporter system for the MAPK, NF-κB, and WNT signaling pathways. *P < 0.001. (B) Western blot analysis demonstrating significantly higher level of phosphorylated ERK1/2, GSK-3β, and NF-κB protein in OVCA432 cells treated with FGF1 at 10 ng/mL for 1 hour (+) versus control cells (−). (C) Real-time cell proliferation assay results showing a significantly lower proliferation rate in OVCA432 cells transfected with Hs_FGFR4_5 and Hs_FGFR4_6 than in those transfected with the nontarget scrambled siRNA under treatment with FGF1 at 10 ng/mL (P < 0.001). (D) Bar charts showing the effect of FGF1 on reporter activity, which was significantly lower in ovarian cancer cells transfected with Hs_FGFR4_5 and Hs_FGFR4_6 than in those transfected with the scrambled siRNA (P < 0.001).
Figure 5
Figure 5
Transcriptome analysis on FGFR4 silenced ovarian cancer cell lines. (A) Venn diagram showing the number of differentially expressed genes (>twofold) common to both OVCA432 and SKOV3 cells transiently transfected with Hs_FGFR4_5 and Hs_FGFR4_6 for 36 hours when compared with those transfected with the nontarget scrambled siRNA. (B) The most significant network associated with FGFR4 silencing. Genes with upregulated and downregulated expression are shown in red and green, respectively.
Figure 6
Figure 6
Targeting FGFR4 decreases ovarian cancer cell growth in vitro. (A) Bioluminescence signals in 12 mice given 20 mg/kg FGFR4:Fc and 12 mice given control IgG from week 0 to week 4. (B) Bioluminescent images of mice given FGFR4:Fc and those given human IgG at week 4 and their corresponding ex vivo tumor samples. (C) Box plot showing significantly lower bioluminescence signals in the 12 mice given FGFR4:Fc than in those given control IgG in week 4 (P = 0.012). The bottom of the box indicates the 25th percentile, the top indicates the 75th percentile, and whiskers indicate 95% confidence intervals. (D) Box plot showing significantly lower tumor weights in OVCA432 tumor-bearing mice given siRNA-Hs_FGFR4_5-DOPC and siRNA-Hs_FGFR4_6-DOPC than in those given control-siRNA-DOPC (P = 0.015 and P = 0.027, respectively). Values greater than one and a half box lengths from either end of the box are denoted by circles and identified as outliers. All values, including the outliers in all experimental groups, were included in statistical analyses.

References

    1. Siegel R, Naishadham D, Jemal A. Cancer statistics, 2012. CA Cancer J Clin. 2012;62:10–29. - PubMed
    1. NIH consensus conference. Ovarian cancer. Screening, treatment, and follow-up. NIH Consensus Development Panel on Ovarian Cancer. JAMA. 1995;273:491–497. - PubMed
    1. Armstrong DK, Bundy B, Wenzel L, Huang HQ, Baergen R, Lele S, et al. Intraperitoneal cisplatin and paclitaxel in ovarian cancer. N Engl J Med. 2006;354:34–43. - PubMed
    1. McGuire WP, Hoskins WJ, Brady MF, Kucera PR, Partridge EE, Look KY, et al. Cyclophosphamide and cisplatin compared with paclitaxel and cisplatin in patients with stage III and stage IV ovarian cancer. N Engl J Med. 1996;334:1–6. - PubMed
    1. Markman M, Rothman R, Hakes T, Reichman B, Hoskins W, Rubin S, et al. Second-line platinum therapy in patients with ovarian cancer previously treated with cisplatin. J Clin Oncol. 1991;9:389–393. - PubMed

Publication types

MeSH terms

Substances