Comparative Study
. 2013 Apr;112(2):257-66.
doi: 10.1007/s11060-013-1057-y. Epub 2013 Jan 24.

Pre- and post-contrast three-dimensional double inversion-recovery MRI in human glioblastoma

Affiliations
Comparative Study

Pre- and post-contrast three-dimensional double inversion-recovery MRI in human glioblastoma

Robert J Harris et al. J Neurooncol. 2013 Apr.

Abstract

Fluid attenuated inversion recovery (FLAIR) MRI sequences have become an indispensible tool for defining the malignant boundary in patients with brain tumors by nulling the signal contribution from cerebrospinal fluid allowing both regions of edema and regions of non-enhancing, infiltrating tumor to become hyperintense on resulting images. In the current study we examined the utility of a three-dimensional double inversion recovery (DIR) sequence that additionally nulls the MR signal associated with white matter, implemented either pre-contrast or post-contrast, in order to determine whether this sequence allows for better differentiation between tumor and normal brain tissue. T1- and T2-weighted, FLAIR, dynamic susceptibility contrast (DSC)-MRI estimates of cerebral blood volume (rCBV), contrast-enhanced T1-weighted images (T1+C), and DIR data (pre- or post-contrast) were acquired in 22 patients with glioblastoma. Contrast-to-noise (CNR) and tumor volumes were compared between DIR and FLAIR sequences. Line profiles across regions of tumor were generated to evaluate similarities between image contrasts. Additionally, voxel-wise associations between DIR and other sequences were examined. Results suggested post-contrast DIR images were hyperintense (bright) in regions spatially similar those having FLAIR hyperintensity and hypointense (dark) in regions with contrast-enhancement or elevated rCBV due to the high sensitivity of 3D turbo spin echo sequences to susceptibility differences between different tissues. DIR tumor volumes were statistically smaller than tumor volumes as defined by FLAIR (Paired t test, P = 0.0084), averaging a difference of approximately 14 mL or 24 %. DIR images had approximately 1.5× higher lesion CNR compared with FLAIR images (Paired t test, P = 0.0048). Line profiles across tumor regions and scatter plots of voxel-wise coherence between different contrasts confirmed a positive correlation between DIR and FLAIR signal intensity and a negative correlation between DIR and both post-contrast T1-weighted image signal intensity and rCBV. Additional discrepancies between FLAIR and DIR abnormal regions were also observed, together suggesting DIR may provide additional information beyond that of FLAIR.


Figures

Fig. 1
Fig. 1
Multiparametric and pre- or post-contrast double inversion recovery (DIR) images in human glioblastoma. a Post-contrast T1-weighted image, b relative cerebral blood volume (rCBV) map, c T2-weighted image, d FLAIR image, and e pre-contrast DIR image in a 48 year old female patient with a glioblastoma. Arrows in e denote regions of thought to contain primarily vasogenic edema due to preservation of the cortical ribbon. f Post-contrast T1-weighted image, g rCBV map, h T2-weighted image, i FLAIR image, and j post-contrast DIR image in a 54 year old female patient with glioblastoma. Arrows in (j) show signal dropout on post-contrast DIR images corresponding to regions of contrast enhancement and elevated rCBV
Fig. 2
Fig. 2
DIR images of human glioblastoma before and after administration of the anti-angiogenic agent bevacizumab. a Post-contrast T1-weighted images, b rCBV maps, c T2-weighted images, d FLAIR images, and e pre-contrast DIR images before administration of bevacizumab in a 57 year old male patient with recurrent glioblastoma. f Post-contrast T1-weighted iamges, g rCBV maps, h T2-weighted images, i FLAIR images, and j pre-contrast DIR images after administration of bevacizumab, demonstrating significant reduction in contrast enhancement, rCBV, and hyperintense lesion volume on T2-weighted, FLAIR, and DIR images
Fig. 3
Fig. 3
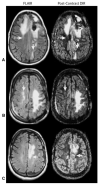
Conspicuous signal abnormalities that differ between FLAIR and DIR images. a Abnormal FLAIR signal intensity within the right frontal lobe extending posterior (“a”) that is not observed on DIR images. Similarly, a FLAIR hyperintense lesion in the left parietal lobe is observed extending inferior into white matter regions (“b”), but this was not observed on DIR images. b Abnormal FLAIR signal intensity in the right hemisphere (“c”), contralateral from the original tumor location, is not clearly apparent on DIR images. c Posterior aspect of a lesion in the left frontal lobe observed on FLAIR (“d”) did not demonstrate substantial hyperintensity on DIR imagesb
Fig. 4
Fig. 4
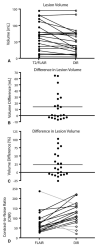
Lesion volume and contrast-to-noise ratio (CNR) comparisons between FLAIR and DIR. a Lesion volume comparisons between FLAIR and DIR images suggests FLAIR may overestimate lesion volume compared to DIR images (Paired t test, P = 0.0084). b Volume difference between FLAIR and DIR demonstrating FLAIR lesion volumes having an average difference of 14 mL compared with DIR lesions. c Percent volume differences between FLAIR and DIR showing FLAIR lesion volumes having an average of 24 % higher volumes compared with DIR lesion volume estimates. d Lesion CNR in FLAIR and DIR showing a significantly higher CNR in DIR compared with FLAIR images (Paired t test, P = 0.0048). Gray lines show four cases where FLAIR had higher CNR compared to DIR
Fig. 5
Fig. 5
Line profiles through tumor regions in four patients with glioblastoma, demonstrating spatial correlation between post-contrast DIR images and multiparametric MRI. a–d) Post-contrast DIR images showing the location of the corresponding line profiles (red lines with “A” and “B”). e–h Line profiles for DIR (black) and FLAIR (gray) showing a strong spatial correlation between these two image contrasts. i–l Line profiles for DIR (black), post-contrast T1-weighted images (T1+C; dashed green), and rCBV (blue line) demonstrating a negative spatial correlation between these image contrasts within tumor regions
Fig. 6
Fig. 6
Voxel-wise coherence between DIR and multiparametric MR images. a–d Voxel-wise associations between FLAIR and DIR signal intensities show a positive linear correlation (Pearson’s correlation coefficient, R2 > 0.6, P < 0.001 for all patients examined). Note that mid-range signal intensity on FLAIR and low signal intensity on DIR corresponded primarily to white matter (WM), mid-range signal intensity on both FLAIR and DIR corresponded to gray matter (GM), while high signal intensity on both FLAIR and DIR corresponded to regions with abnormal T2/FLAIR signal intensity. e–f Voxel-wise associations between post-contrast T1-weighted (T1+C) and DIR signal intensities show a negative linear correlation (Pearson’s correlation coefficient, R2 > 0.6, P < 0.001 for all patients examined). Note that voxels with mid-range signal intensity on T1+C and low signal intensity on DIR corresponded to WM, voxels with mid-range signal intensity on both T1+C and DIR corresponded to GM, voxels with low-signal intensity on T1+C and high signal intensity on DIR corresponded to regions with abnormal T2/FLAIR signal intensity, and voxels with high signal intensity on T1+C and low signal intensity on DIR corresponded to regions with contrast-enhancement. i–l Voxel-wise associations between rCBV and DIR signal intensities showing a negative linear correlation (Pearson’s correlation coefficient, R2 > 0.6, P < 0.001 for all patients examined). Note that voxels with high rCBV and low signal intensity on DIR corresponded to regions of contrast-enhancement and hypervascular tumor, voxels with low rCBV and low signal intensity on DIR corresponded to WM, voxels with mid-range values of both rCBV and DIR signal intensity corresponded to GM, and voxels with low rCBV and high DIR signal intensity corresponded to regions with abnormal T2/FLAIR signal intensities

References

    1. Lima FR, Kahn SA, Soletti RC, Biasoli D, Alves T, da Fonseca AC, Garcia C, Romao L, Brito J, Holanda-Afonso R, Faria J, Borges H, Moura-Neto V. Glioblastoma: therapeutic challenges, what lies ahead. Biochim Biophys Acta. 1826:338–349. 2012. - PubMed
    1. Mouthuy N, Cosnard G, Abarca-Quinones J, Michoux N. Multiparametric magnetic resonance imaging to differentiate high-grade gliomas and brain metastases. J Neuroradiol. 2011;39(5):301–307. - PubMed
    1. Iliadis G, Kotoula V, Chatzisotiriou A, Televantou D, Eleftheraki AG, Lambaki S, Misailidou D, Selviaridis P, Fountzilas G. Volumetric and MGMT parameters in glioblastoma patients: survival analysis. BMC Cancer. 2012;12:3. - PMC - PubMed
    1. Farace P, Giri MG, Meliado G, Amelio D, Widesott L, Ricciardi GK, Dall’Oglio S, Rizzotti A, Sbarbati A, Beltramello A, Maluta S, Amichetti M. Clinical target volume delineation in glioblastomas: pre-operative versus post-operative/pre-radiotherapy MRI. Br J Radiol. 2011;84:271–278. - PMC - PubMed
    1. Tsuchiya K, Mizutani Y, Hachiya J. Preliminary evaluation of fluid-attenuated inversion-recovery MR in the diagnosis of intracranial tumors. AJNR Am J Neuroradiol. 1996;17:1081–1086. - PMC - PubMed

Publication types