. 2013 Apr;199(4):295-313.
doi: 10.1007/s00359-013-0794-x. Epub 2013 Jan 24.

Stimulus change detection in phasic auditory units in the frog midbrain: frequency and ear specific adaptation

Affiliations

Stimulus change detection in phasic auditory units in the frog midbrain: frequency and ear specific adaptation

Abhilash Ponnath et al. J Comp Physiol A Neuroethol Sens Neural Behav Physiol. 2013 Apr.

Abstract

Neural adaptation, a reduction in the response to a maintained stimulus, is an important mechanism for detecting stimulus change. Contributing to change detection is the fact that adaptation is often stimulus specific: adaptation to a particular stimulus reduces excitability to a specific subset of stimuli, while the ability to respond to other stimuli is unaffected. Phasic cells (e.g., cells responding to stimulus onset) are good candidates for detecting the most rapid changes in natural auditory scenes, as they exhibit fast and complete adaptation to an initial stimulus presentation. We made recordings of single phasic auditory units in the frog midbrain to determine if adaptation was specific to stimulus frequency and ear of input. In response to an instantaneous frequency step in a tone, 28% of phasic cells exhibited frequency specific adaptation based on a relative frequency change (delta-f=±16%). Frequency specific adaptation was not limited to frequency steps, however, as adaptation was also overcome during continuous frequency modulated stimuli and in response to spectral transients interrupting tones. The results suggest that adaptation is separated for peripheral (e.g., frequency) channels. This was tested directly using dichotic stimuli. In 45% of binaural phasic units, adaptation was ear specific: adaptation to stimulation of one ear did not affect responses to stimulation of the other ear. Thus, adaptation exhibited specificity for stimulus frequency and lateralization at the level of the midbrain. This mechanism could be employed to detect rapid stimulus change within and between sound sources in complex acoustic environments.


Figures

Fig. 1
Fig. 1
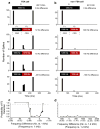
Example of recording localization and schematics of stimuli used to test adaptation sensitivity to frequency step changes. a Coronal slice (20 μm thick) of midbrain with Nissl stain showing a recording site (arrow), which is enlarged in inset. b Schematic of a tuning curve and two frequencies used in frequency step tests. F1 is at the best frequency (BF), and F2 can range above and below the BF. c Schematic of stimuli used to test sensitivity to a frequency step. Stimulus set 1 comprised a constant 200 ms tone with frequency F1. Stimulus set 2 began with 100 ms at F1, then transitioned to F2, with the frequency change occurring at the 0 crossing closest to 100 ms, as depicted in the higher time resolution sine wave below. Action potentials were sorted into either the onset response window (ORW) or the change response window (CRW). d To ensure responses in FSA cells were due to frequency change and not sensitivity change, stimulus set 3 included amplitude steps at the F1 frequency over a 36 dB amplitude range (±18 dB) with no change in frequency. Cells were considered FSA if they had action potentials in the CRW after frequency changes in stimulus set 2, but not spontaneously in set 1 or after amplitude changes in set 3 (data for these amplitude control experiments not shown)
Fig. 2
Fig. 2
Example of FSA and non-FSA in single cells. a Post stimulus time histograms (PSTHs) for an onset/offset phasic cell in response to a tone. Adaptation was not maintained for frequency step changes. b PSTHs for an onset cell in which adaptation was maintained for frequency changes. cd Curves showing the probability of detecting the F1 to F2 change as a function of F2–F1 (or F2/F1). Dashed lines represent significant change detection. Histogram bin width is 10 ms. Number of repetitions were 106, 76, 22 and 21 in (a). b stimulus repetitions are 20 for each histogram. Stimulus amplitude in a and b were 82 and 80 dB SPL, respectively
Fig. 3
Fig. 3
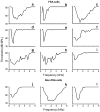
Examples of tuning curves for several FSA and non- FSA cells. Letters correspond to FSA curves shown in Fig. 4. There was no difference in tuning characteristics between
Fig. 4
Fig. 4
FSA curves showing the probability of overcoming adaptation in response to an F1-to-F2 step as a function of F2/F1. Letters correspond to tuning curves shown in Fig. 3. ai FSA cells. Left, middle and right columns show cells that detected frequency change in downward, upward or both directions. ji Non-FSA cells did not exhibit significant frequency change detection. Dashed lines represent hit probability for significant change detection. Because F1 is at the best frequency (±200 Hz), the actual F1-to-F2 frequency change can be determined using Fig. 3
Fig. 5
Fig. 5
Frequency required to elicit FSA as a function of F1. Solid and open symbols are for frequency increases and decreases, respectively. The mean relative increase and decrease were 1.15 ± 0.12 and 0.84 ± 0.12, respectively. Curves show a ±16 % change as a function of F1
Fig. 6
Fig. 6
FSA versus non-FSA responses to continuous frequency modulated stimuli. a Tuning and voltage response of an FSA cell presented with a tone at the best frequency and an FM stimulus across the excitatory bandwidth (at 90 dB) of the tuning curve. b non-FSA cell for the same stimuli. Compared to non-FSA cells, there was a significant increase in action potential number to FM stimuli (re. tone stimuli) in FSA cells (Table 1)
Fig. 7
Fig. 7
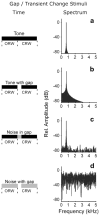
ad. Gap stimuli and their spectra used to test sensitivity to transient frequency change. The example tone is at 700 Hz. Action potentials (Fig. 8; Supplementary Fig. 1) were analyzed as occurring in the onset response window (ORW) or the change response window (CRW), the latter beginning at the start of the gap and ending at the end of the entire stimulus. The response windows varied with gap duration. False alarms were action potentials in the CRW for control stimuli without a gap (e.g., 200 ms tone or noise). b the gap produces both transient spectral and temporal cues in the tone; c a noise filed gap in a tone largely removes envelope fluctuations and produces spectral cues; d the gap in noise produces only temporal cues as the spectrum is the same as that for a noise without a gap (not shown)
Fig. 8
Fig. 8
Post stimulus time histograms showing responses of an FSA and a non-FSA cell to three different gap stimuli. a Gap in a tone which had both spectral and temporal cues. b Noise fills gap in a tone producing only spectral cues. c Gap in noise, producing only temporal cues. The FSA cell exhibited better gap detection than the non-FSA cell when spectral cues were present
Fig. 9
Fig. 9
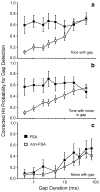
Summary of gap detection for three different stimuli with different cues for stimulus change. ab For FSA cells (closed squares), gap duration had no effect on corrected hit probability when spectral cues were present. There is a significant difference between FSA and non-FSA (open squares) hit probability for these two stimuli (FSA vs. non-FSA tones: F = 38.07, P<0.0001; noise in tones: F = 25.15, P<0.0001). c When only temporal cues were present, gap detection was similar in the two cell classes (F = 0.05, P = 0.82)
Fig. 10
Fig. 10
Example PSTHs and voltage traces of ESA and non-ESA responses to dichotic stimuli. Ipsi- and contralateral stimuli (blue and red, respectively) are shown above each PSTH. ae ESA cell showing adaptation was not maintained for the ipsi-then-contralateral stimulus. fj non-ESA cell in which adaptation was maintained, as the cell did not respond to dichotic stimulus change. ko non-ESA cell which responded to dichotic change, but also responded to amplitude modulation. This test (e, j, o) controlled for the possibility that dichotic responses could have been mediated by sensitivity to amplitude modulation. Each stimulus is presented 20 times. The entire sequence of responses to all test and control stimuli (along with cell tuning) are shown in supplementary Figs. 2–4
Fig. 11
Fig. 11
Post stimulus time histograms for a cell showing ESA response to noise stimuli. Ipsi- and contralateral stimuli (blue and red, respectively) are shown above each PSTH. ab Monaural response to 100 ms control stimuli. cd Monaural response to 200 ms control stimuli; response after 100 ms revealed false alarms. ef Dichotic stimuli revealing ESA for ipsi-then-contralateral stimuli

Similar articles

Cited by

References

    1. Adrian ED, Zotterman Y. The impulses produced by sensory nerve-endings: part II. The response of a single end-organ. J Physiol. 1926;61:151–171. - PMC - PubMed
    1. Antunes FM, Nelken I, Covey E, Malmierca MS. Stimulus-specific adaptation in the auditory thalamus of the anesthetized rat. PLoS One. 2010;5:e14071. - PMC - PubMed
    1. Bass AH, Rose GJ, Pritz MB. Auditory midbrain of fish, amphibians and reptiles: model systems for understanding auditory function. In: Winer JA, Schreiner CE, editors. The inferior colliculus. Springer; New York: 2005. pp. 459–492.
    1. Bauerle P, von der BW, Kossl M, Gaese BH. Stimulus-specific adaptation in the gerbil primary auditory thalamus is the result of a fast frequency-specific habituation and is regulated by the corticofugal system. J Neurosci. 2011;31:9708–9722. - PMC - PubMed
    1. Bee MA, Micheyl C. The cocktail party problem: what is it? How can it be solved? And why should animal behaviorists study it? J Comp Psychol. 2008;122:235–251. - PMC - PubMed

Publication types