. 2013 Jan 23;33(4):1297-313.
doi: 10.1523/JNEUROSCI.2935-12.2013.

Glial cells decipher synaptic competition at the mammalian neuromuscular junction

Affiliations

Glial cells decipher synaptic competition at the mammalian neuromuscular junction

Houssam Darabid et al. J Neurosci. .

Abstract

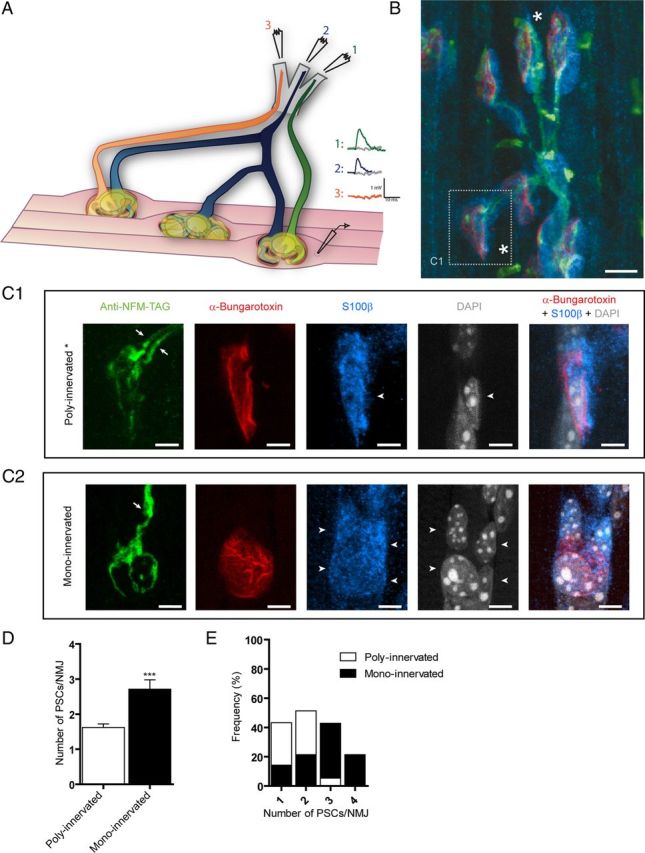
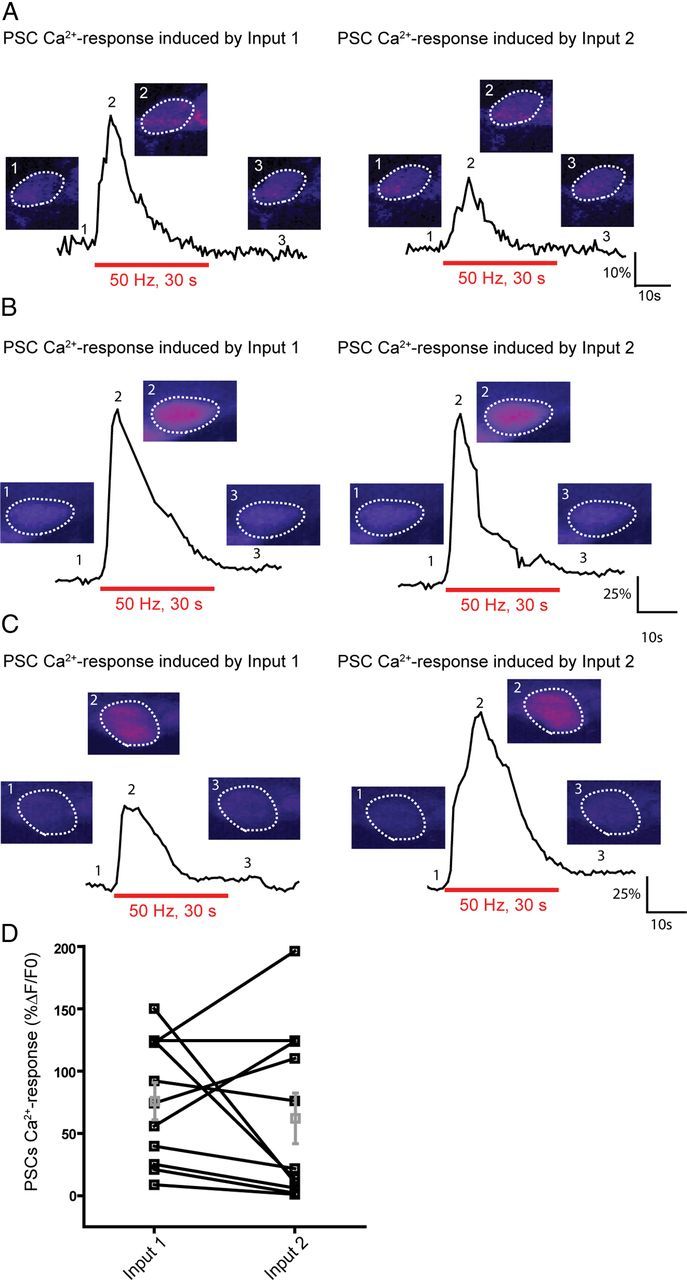
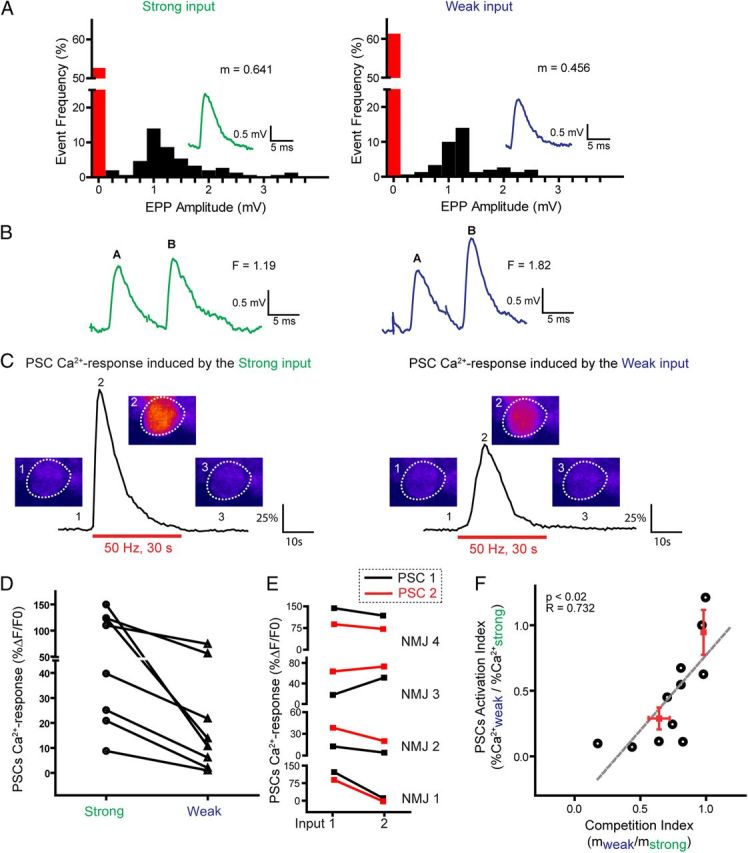
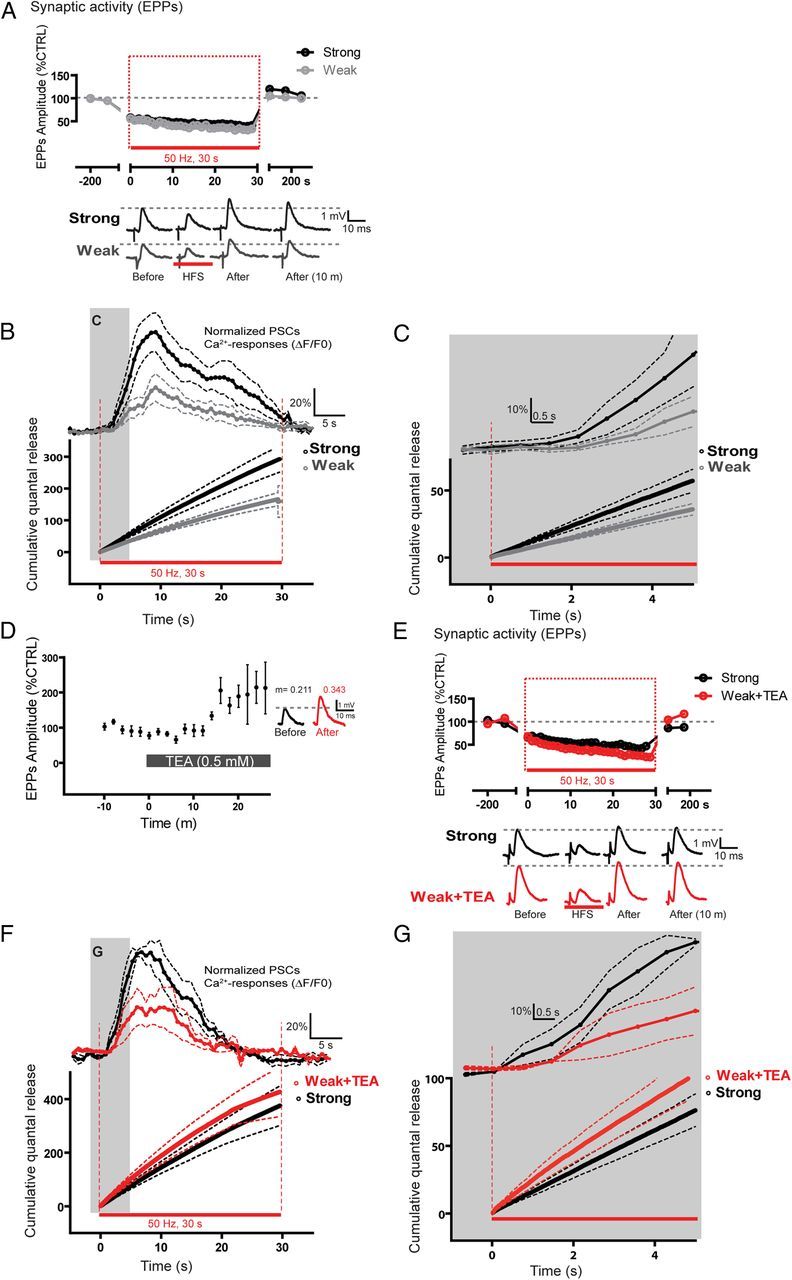
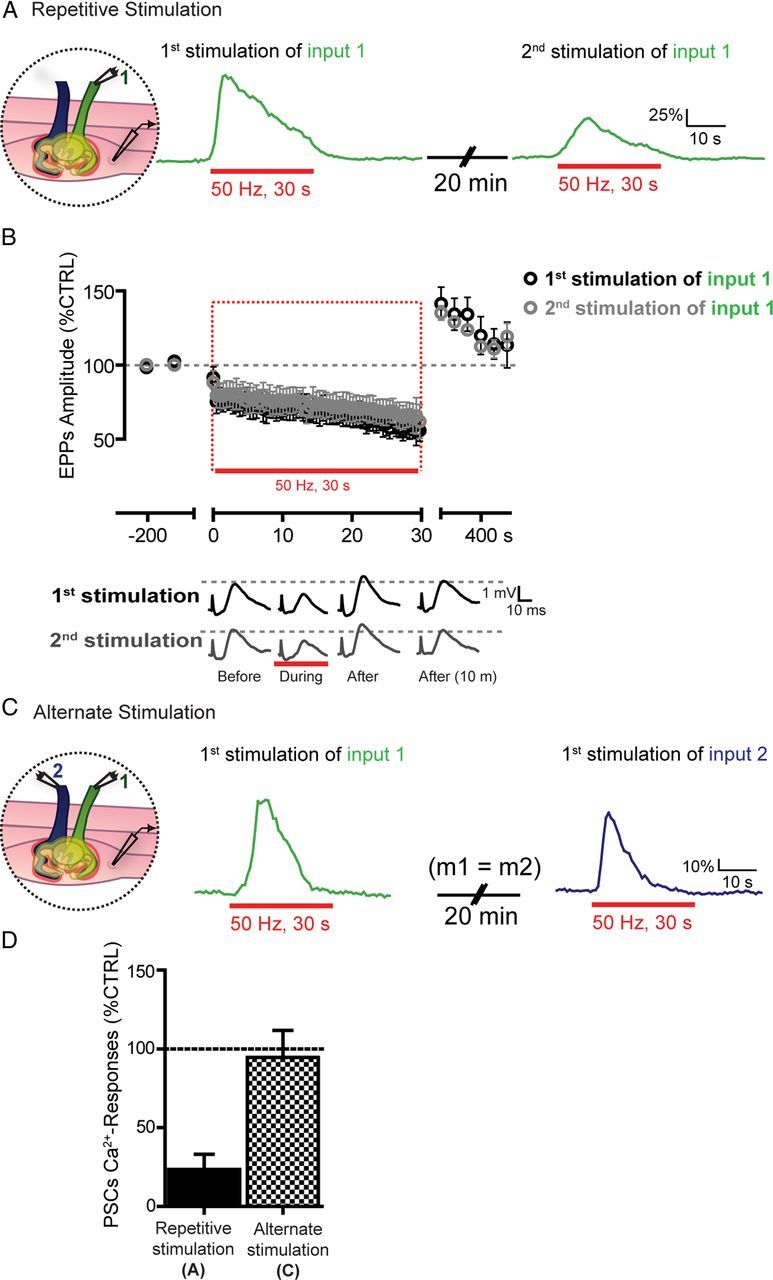
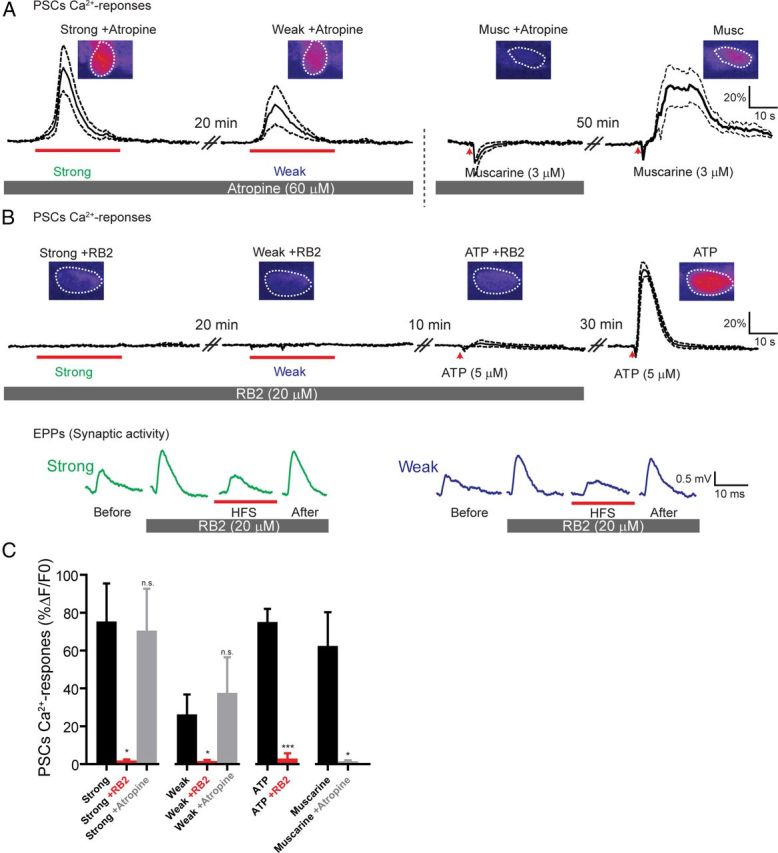
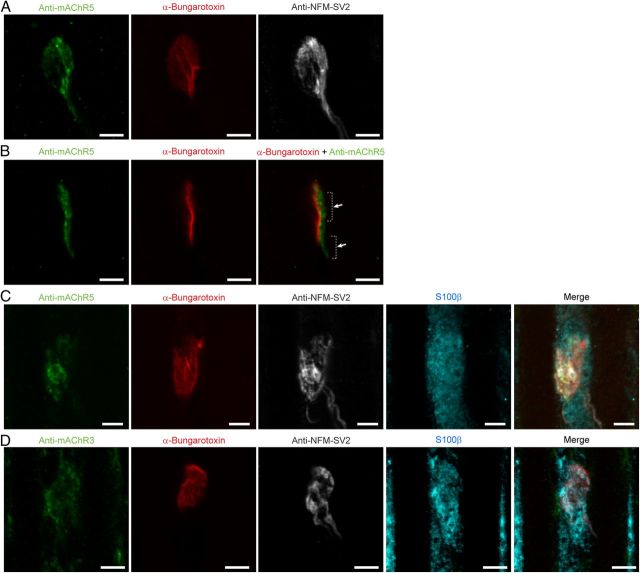
It is now accepted that glial cells actively interact with neurons and modulate their activity in many regions of the nervous system. Importantly, modulation of synaptic activity by glial cells depends on the proper detection and decoding of synaptic activity. However, it remains unknown whether glial cells are capable of decoding synaptic activity and properties during early postdevelopmental stages, in particular when different presynaptic nerve terminals compete for the control of the same synaptic site. This may be particularly relevant because a major determinant of the outcome of synaptic competition process is the relative synaptic strength of competing terminals whereby stronger terminals are more likely to occupy postsynaptic territory and become stabilized while weaker terminals are often eliminated. Hence, because of their ability to decode synaptic activity, glial cells should be able to integrate neuronal information of competing terminals. Using simultaneous glial Ca(2+) imaging and synaptic recordings of dually innervated mouse neuromuscular junctions, we report that single glial cells decipher the strength of competing nerve terminals. Activity of single glial cells, revealed by Ca(2+) responses, reflects the synaptic strength of each competing nerve terminal and the state of synaptic competition. This deciphering is mediated by functionally segregated purinergic receptors and intrinsic properties of glial cells. Our results indicate that glial cells decode ongoing synaptic competition and, hence, are poised to influence its outcome.


Figures

Figure 1.
Figure 1.
PSCs during synaptic competition at the mammalian NMJ. A, Diagram illustrating the experimental situation where transmitter release from a dually innervated NMJ was recorded with a sharp microelectrode and synaptic responses evoked by independent stimulation of two different ventral roots. B, Labeling of presynaptic terminals (green), PSCs (blue), and postsynaptic nAChR (red) of P7 Soleus NMJs. At this age, most NMJs were poly-innervated (as shown in C1 and marked with “*”), but some NMJs were already mono-innervated. C1, At dually innervated NMJs, two independent axonal branches (in green, arrows) converged at the same endplate area (red). Also note that a single PSC (blue) covered the whole endplate area and both nerve terminals. PSCs counted (arrowheads) were positive for S100β (blue) and DAPI (gray) staining and were located at the endplate (red). C2, At mono-innervated NMJs, one axon (in green, arrow) was observed at the endplate area (red). This NMJ was from another muscle preparation than in B and C1. D, Histogram of the number of PSCs at poly-innervated and mono-innervated NMJs. Note that there were more PSCs at mono-innervated than poly-innervated NMJs. Unpaired t test, p < 0.0001. E, Distribution of the number of PSCs at mono-innervated and poly-innervated NMJs. Note that most poly-innervated NMJs had 1 or 2 PSCs. Scale bars: B, 10 μm; C1, C2, 5 μm.
Figure 2.
Figure 2.
A single PSC detects synaptic activity of competing nerve terminals at dually innervated NMJs. A, Example of Ca2+ responses elicited in a PSC by independent stimulation of the two competing nerve terminals (Input 1 and Input 2). False color images of the changes in fluorescence of Fluo-4 illustrating Ca2+ levels before, at the peak of the response, and after the stimulation. Note that the first input (Input 1) induced a bigger Ca2+ response than the second one (Input 2). B, An example of PSC Ca2+ responses where both inputs induced similar PSC Ca2+ responses. C, A third example where the first input induced a smaller PSC Ca2+ response than the second one. D, Plot illustrating the diversity of PSC Ca2+ responses induced by two inputs at poly-innervated NMJs.
Figure 3.
Figure 3.
A single PSC decodes synaptic strength of competing nerve terminals at dually innervated NMJs. A, Distribution of EPP amplitude induced by stimulation of the strong and weak inputs, including failures. Inset, Examples of EPPs and calculated quantal content (m). B, Examples of EPPs and facilitation values (F) obtained from the paired-pulse (10 ms interval) independent stimulation of strong and weak inputs shown in A. C, Ca2+ responses elicited in a PSC by independent stimulation of the strong and weak competing inputs (same as in A and B). False color confocal images of changes in fluorescence of Fluo-4 illustrating Ca2+ levels before, at the peak of the response, and after stimulation. D, Plot of the amplitude of PSC Ca2+ responses induced by strong (circle) and weak (triangle) terminals. PSC Ca2+ responses induced by terminals in competition at the same NMJ are connected with a black line. Note that strong inputs always induced larger Ca2+ responses than weak inputs. E, Ca2+ responses induced in two PSCs at the same dually innervated NMJs. Note that the relationship between Ca2+ responses elicited by the two inputs was the same for both PSCs (black and red) at the same NMJ. F, Relationship between the relative synaptic strength of the competing nerve terminals (CI, x-axis) and the relative responsiveness of the PSCs upon their activation by the independent activity of the competing nerve terminals (PSC activation index, y-axis). Each point (●) represents an individual experiment, and the red points are the average for the experiments where synaptic strength ratio was close to 1 and close to 0.5. The strong linear relationship (r = 0.732; p < 0.02) indicates that PSC responsiveness is tightly influenced by the disparity of the strength of the competing nerve terminals.
Figure 4.
Figure 4.
PSC Ca2+ responses do not solely depend on the amount of neurotransmitters released. A, Top, Changes in EPP amplitude before, during, and after motor nerve stimulation (red bar) of the strong (black) and weak (gray) competing inputs at the same NMJ. Period of high-frequency stimulation used to elicit PSCs Ca2+ responses is highlighted (red rectangle). Bottom, Examples of EPPs induced by stimulation of strong and weak inputs before, during, and after high-frequency stimulation. B, Cumulative quantal release ± SEM (dotted lines) obtained during the high-frequency stimulation (red box in A) of strong (black) and weak inputs (gray) at dually innervated NMJs. Top, Corresponding average PSC Ca2+ responses ± SEM (dotted lines) induced by synaptic activity of weak (gray) and strong (black) inputs. Ca2+ responses are temporally aligned with the timing of the synaptic activity. Note that the strong input had a higher cumulative quantal release and evoked larger PSC Ca2+ responses. The gray zone frames the part illustrated in C. C, Similar representation as in B, but illustrating the first 5 s of the stimulation period to emphasize the different kinetics of transmitter release and PSC responses at the onset of activity. D, Effect of TEA (0.5 mm) bath application on EPP amplitude of weak inputs at dually innervated NMJs. Inset, Examples of EPPs and the calculated quantal content (m) before and during TEA application. Note that TEA increased both EPP amplitude and quantal content of weak terminals. E, Top, Changes in EPP amplitude before, during, and after motor nerve stimulation (red bar) for the strong (black) and weak TEA-potentiated (red) competing inputs of the same NMJ. The period of high-frequency stimulation eliciting PSC Ca2+ responses is highlighted (red rectangle). Bottom, Examples of EPPs induced by the stimulation of strong and weak inputs before, during, and after high-frequency stimulation. F, Cumulative quantal release ± SEM (dotted lines) obtained during high-frequency stimulation (red rectangle in E) of weak TEA-potentiated (red) and strong inputs (black) at dually innervated NMJs. Transmitter release of the weak nerve terminal was potentiated by TEA (0.5 mm) so that it was similar or even slightly larger than the levels observed at nonpotentiated strong inputs. Top, Average of the corresponding PSC Ca2+ responses ± SEM (dotted lines) induced by synaptic activity of the unchanged strong (black) and the weak potentiated input by TEA (red). Note that PSC Ca2+ responses triggered by potentiated weak input were still smaller than those triggered by the nonpotentiated strong input. The gray zone frames the part of the figure illustrated in G. G, Similar representation as in F, but illustrating the first 5 s of the stimulation period.
Figure 5.
Figure 5.
Rundown in PSC Ca2+ responses after repetitive stimulations. A, PSC Ca2+ responses induced by the sustained stimulation of the same input (Input 1). Note that the second PSC Ca2+ response induced by the second stimulation of the same input was smaller than the first one. B, Top, Changes in EPP amplitude ± SEM before, during, and after the first (black) and second (gray) nerve stimulation of the same input (Input 1). The period of high-frequency stimulation used to elicit PSCs Ca2+ responses is highlighted (red rectangle). Bottom, Examples of EPPs induced by the first and second stimulation of Input 1 before, during, and after the high-frequency stimulation. Note that EPP amplitudes induced by the first and second stimulation of the same input are similar. C, PSC Ca2+ responses induced by the alternate stimulation of Input 1 followed, 20 min later, by the stimulation of Input 2 at NMJs where both inputs had similar quantal content (m1 indicates the quantal content of Input 1; and m2, the quantal content of Input 2). Note that Ca2+ responses from both PSCs were similar, with no evident rundown. D, Histogram showing the mean of the normalized amplitude of the second PSC Ca2+ responses in the repetitive (same input, black, A) and alternate paradigms (alternate inputs, gray, C).
Figure 6.
Figure 6.
PSCs Ca2+ responses are mediated by P2Y receptors, not muscarinic receptors. A, PSC responsiveness to ventral root stimulation during bath application of the mAChR antagonist, atropine (60 μm). Note that atropine did not prevent PSC Ca2+ responses induced by the strong and the weak input stimulations but antagonized responses induced by local application of the mAChR agonist, muscarine (3 μm). The dark trace represents the average of PSC Ca2+ responses; and the dotted lines represent SEM. Inset, False color confocal images showing changes in fluorescence of Fluo-4 at the peak of the response. B, Top, PSC Ca2+ activity evoked in the presence of the P2Y receptor antagonist, RB2 (20 μm). Note that no Ca2+ responses were evoked in the presence of RB2 either by stimulation of the strong or the weak input. Also, responses induced by local application of the P2Y receptor agonist, ATP (3 μm), were antagonized. Bottom, Examples of EPPs induced by the strong and weak inputs before and during RB2 application. Note that the lack of PSC Ca2+ responses cannot be attributed to the absence of synaptic activity because EPPs were still elicited by motor nerve stimulation. C, Histogram showing PSC Ca2+ responses induced by strong and weak inputs and local application of agonists in the different conditions studied.
Figure 7.
Figure 7.
P2Y1Rs at poly-innervated NMJs. A, z-stack of false color of 9 confocal images of immunohistochemical labeling of type 1 P2Y receptors (P2Y1R; green), postsynaptic nAChRs (α-bungarotoxin; red), and presynaptic terminals (NF-SV2; gray) at a P7 poly-innervated NMJ. Note that P2Y1Rs were arranged in “hotspots,” with a punctuated distribution throughout the endplate area (in red). B, A single focal plane of the NMJ presented in A showing P2Y1Rs (green) and postsynaptic nAChRs (red). Note that P2Y1Rs and nAChRs are located at a different level and do not colocalize (dashed lines and arrows represent 2 regions where P2Y1R and nAChR did not overlap). C, Confocal z-stack of 5 images of en face view of a P7 poly-innervated NMJ showing P2Y1R (green), presynaptic terminals (NF-SV2; red), and dextran-loaded PSCs (gray). Note that P2Y1R labeling was present in the area of the dextran-loaded PSCs. Dotted boxes in the right panel highlight the regions enlarged in D and E. D, Higher magnification of a part of the NMJ presented in C. Note the puncta of P2Y1Rs (green) over the area of the PSCs, interspersed in between presynaptic labeling and closely associated with presynaptic active zones (NF-SV2; red). Note also that very few P2Y1 hotspots colocalized with presynaptic elements (yellow spots, asterisks in right panel). E, Same as in D but illustrating the E dotted box highlighted in C. F, An image of a single plane focusing on the top of the NMJ showing hotspots of P2Y1R (green) localized within the dextran-loaded PSC (gray) where the presynaptic staining (NF -SV2; red) was out of focus (arrows). Scale bars: AC, F, 5 μm; D, E, 2 μm.
Figure 8.
Figure 8.
Type 5 and Type 3 mAChRs at poly-innervated NMJs. A, False color confocal z-stack of 10 images of immunohistochemical labeling of Type 5 mAChRs (mAChR5; green), postsynaptic nAChRs (α-bungarotoxin; red), and presynaptic terminals (NF-SV2; gray) at a P7 poly-innervated NMJ. Note the diffuse organization of mAChR5 that covers most of the endplate area in red. B, A single focal plane of the NMJ presented in A showing mAChR5 (green) and postsynaptic nAChRs (red). Note that mAChR5 and nAChR were located at a different level and did not colocalize (hyphenated lines and arrows show 2 regions where mAChR5 and nAChR did not overlap). C, False color confocal z-stack of 5 images of quadruple immunohistochemical labeling of another P7 poly-innervated NMJ showing the diffuse distribution of mAChR5 (green), postsynaptic nAChRs (α-bungarotoxin; red), presynaptic terminals (NF -SV2; gray), and PSCs (S100β; cyan). D, False color confocal z-stack of 5 images of quadruple immunohistochemical labeling of another P7 poly-innervated NMJ showing the distribution mAChR3. As for mAChR5, mAChR3 labeling was diffuse and uniform throughout the endplate area (red). Scale bars, 5 μm.
Figure 9.
Figure 9.
Territorial distribution of P2Y1R receptors at poly-innervated and mono-innervated NMJs. A, False color confocal z-stack of 16 images of P2Y1R labeling (left; blue) showing two regions (dotted lines and arrows) of different fluorescence intensity at the NMJ. Black/dark blue represents low pixel intensity; and light blue/white, higher intensities. The corresponding AChR labeling delineates the endplate area (right; α-bungarotoxin in gray). Note that the region on the right shows higher fluorescence intensity than the left one, suggesting that more P2Y1Rs were present. B, z-stack of 10 images of another poly-innervated NMJ showing a more uniform distribution of P2Y1Rs (left, blue) throughout the endplate area (right, α-bungarotoxin in gray). C, z-stack of 8 images of a P7 mono-innervated NMJ showing a nonuniform distribution of P2Y1Rs where the left region had higher fluorescence intensity than the right one, suggesting that more P2Y1Rs were present (dotted lines and arrows) over the endplate area (right; α-bungarotoxin in gray). D, z-stack of 10 images of another P7 mono-innervated NMJ showing a more uniform distribution of P2Y1Rs (left; blue) throughout the NMJ (right; α-bungarotoxin in gray). Scale bars, 5 μm.

References

    1. Alexander JJ, Anderson AJ, Barnum SR, Stevens B, Tenner AJ. The complement cascade: Yin-Yang in neuroinflammation–neuro-protection and -degeneration. J Neurochem. 2008;107:1169–1187. - PMC - PubMed
    1. Auld DS, Robitaille R. Glial cells and neurotransmission: an inclusive view of synaptic function. Neuron. 2003;40:389–400. - PubMed
    1. Balice-Gordon RJ, Lichtman JW. Long-term synapse loss induced by focal blockade of postsynaptic receptors. Nature. 1994;372:519–524. - PubMed
    1. Bishop DL, Misgeld T, Walsh MK, Gan WB, Lichtman JW. Axon branch removal at developing synapses by axosome shedding. Neuron. 2004;44:651–661. - PubMed
    1. Brill MS, Lichtman JW, Thompson W, Zuo Y, Misgeld T. Spatial constraints dictate glial territories at murine neuromuscular junctions. J Cell Biol. 2011;195:293–305. - PMC - PubMed

Publication types

LinkOut - more resources