

Bradykinin-induced chemotaxis of human gliomas requires the activation of KCa3.1 and ClC-3
- PMID: 23345219
- PMCID: PMC3711544
- DOI: 10.1523/JNEUROSCI.3980-12.2013
Bradykinin-induced chemotaxis of human gliomas requires the activation of KCa3.1 and ClC-3
Abstract
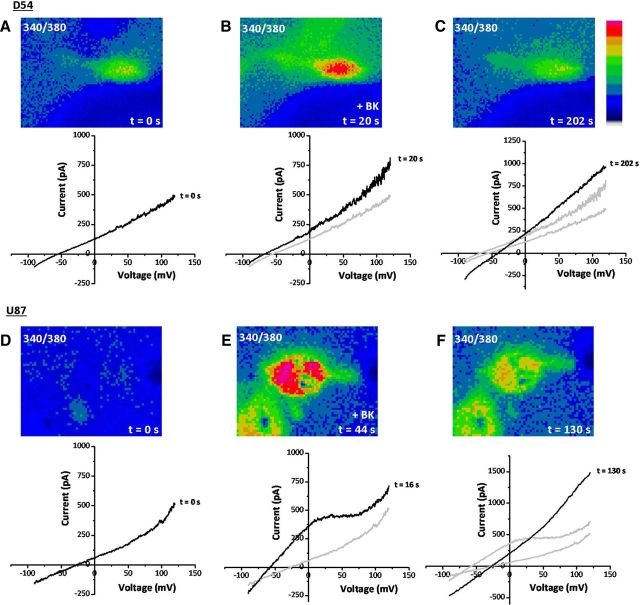
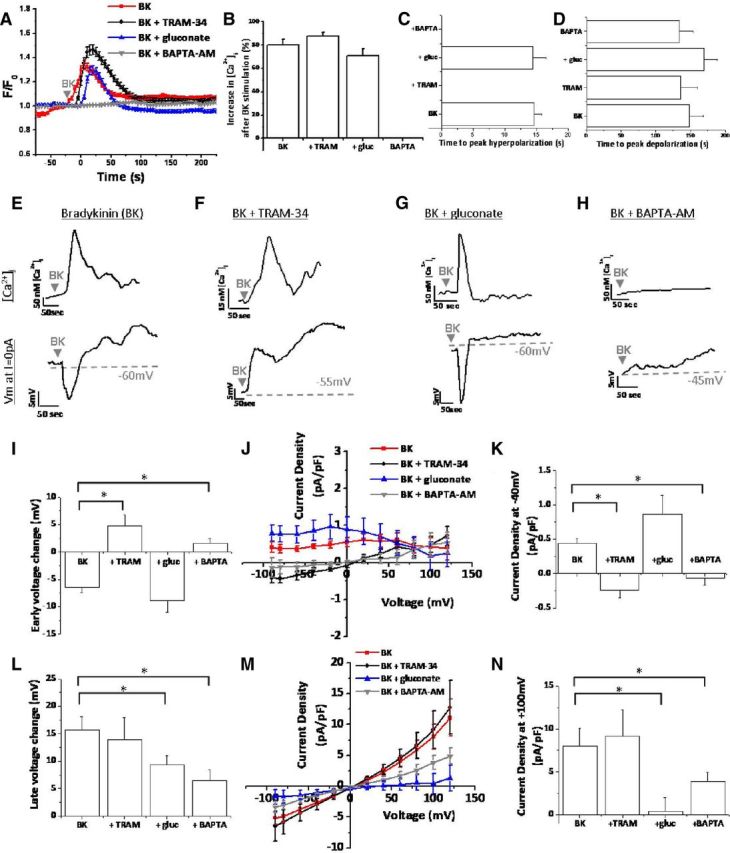
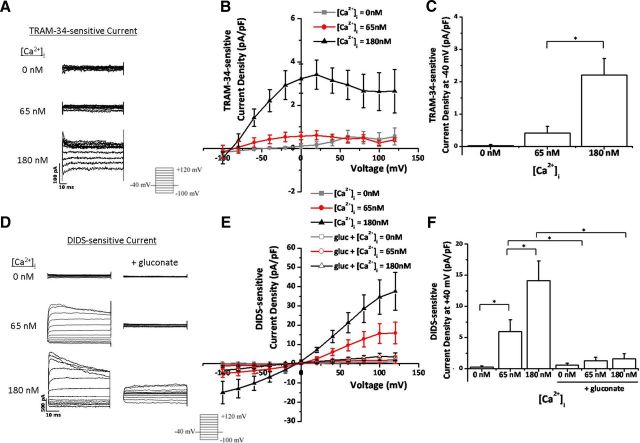
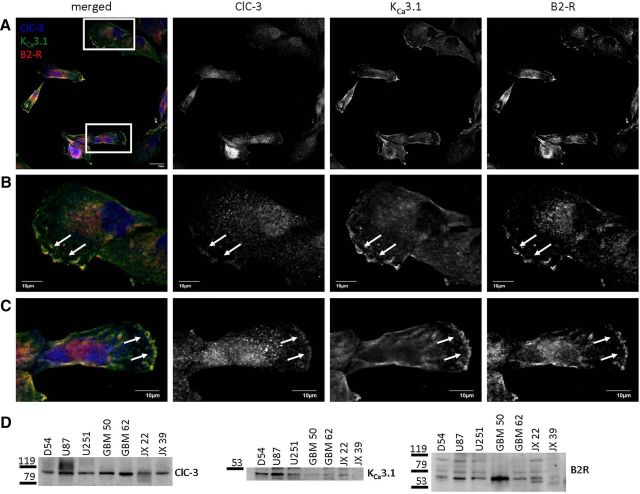
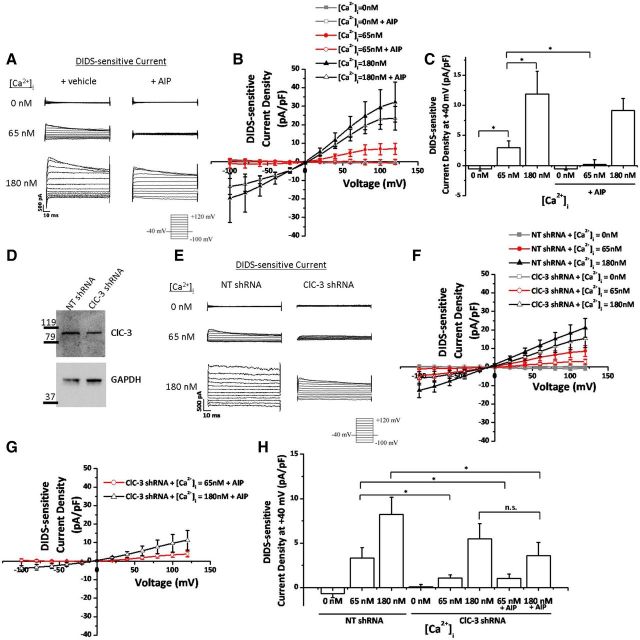
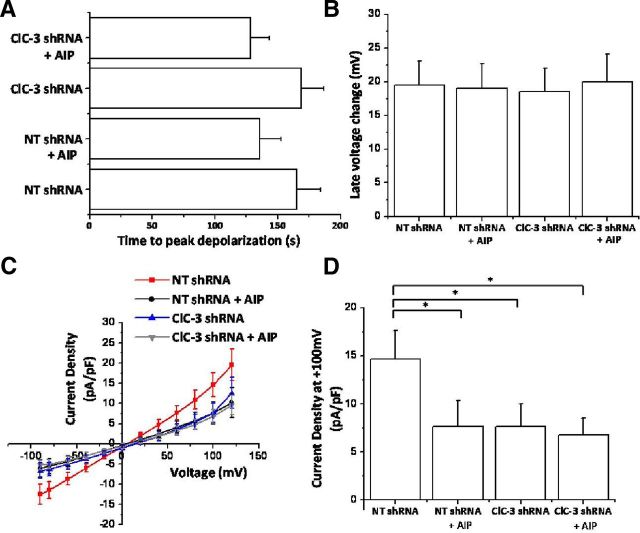
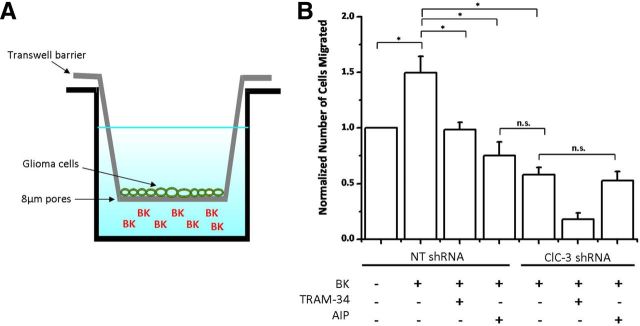
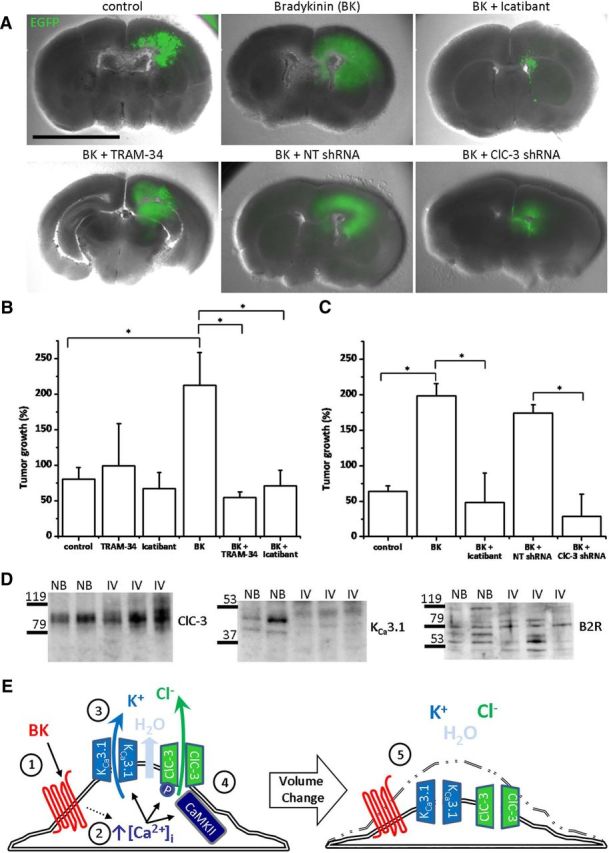
Previous reports demonstrate that cell migration in the nervous system is associated with stereotypic changes in intracellular calcium concentration ([Ca(2+)](i)), yet the target of these changes are essentially unknown. We examined chemotactic migration/invasion of human gliomas to study how [Ca(2+)](i) regulates cellular movement and to identify downstream targets. Gliomas are primary brain cancers that spread exclusively within the brain, frequently migrating along blood vessels to which they are chemotactically attracted by bradykinin. Using simultaneous fura-2 Ca(2+) imaging and amphotericin B perforated patch-clamp electrophysiology, we find that bradykinin raises [Ca(2+)](i) and induces a biphasic voltage response. This voltage response is mediated by the coordinated activation of Ca(2+)-dependent, TRAM-34-sensitive K(Ca)3.1 channels, and Ca(2+)-dependent, 4,4'-diisothiocyanato-stilbene-2,2'-disulfonic acid (DIDS)-sensitive and gluconate-sensitive Cl(-) channels. A significant portion of these Cl(-) currents can be attributed to Ca(2+)/calmodulin-dependent protein kinase II (CaMKII) activation of ClC-3, a voltage-gated Cl(-) channel/transporter, because pharmacological inhibition of CaMKII or shRNA-mediated knockdown of ClC-3 inhibited Ca(2+)-activated Cl(-) currents. Western blots show that K(Ca)3.1 and ClC-3 are expressed in tissue samples obtained from patients diagnosed with grade IV gliomas. Both K(Ca)3.1 and ClC-3 colocalize to the invading processes of glioma cells. Importantly, inhibition of either channel abrogates bradykinin-induced chemotaxis and reduces tumor expansion in mouse brain slices in situ. These channels should be further explored as future targets for anti-invasive drugs. Furthermore, these data elucidate a novel mechanism placing cation and anion channels downstream of ligand-mediated [Ca(2+)](i) increases, which likely play similar roles in other migratory cells in the nervous system.
Figures
Similar articles
-
Calcium entry via TRPC1 channels activates chloride currents in human glioma cells.Cell Calcium. 2013 Mar;53(3):187-94. doi: 10.1016/j.ceca.2012.11.013. Epub 2012 Dec 20. Cell Calcium. 2013. PMID: 23261316 Free PMC article.
-
Volume-activated chloride currents contribute to the resting conductance and invasive migration of human glioma cells.J Neurosci. 2001 Oct 1;21(19):7674-83. doi: 10.1523/JNEUROSCI.21-19-07674.2001. J Neurosci. 2001. PMID: 11567057 Free PMC article.
-
Molecular interaction and functional regulation of ClC-3 by Ca2+/calmodulin-dependent protein kinase II (CaMKII) in human malignant glioma.J Biol Chem. 2010 Apr 9;285(15):11188-96. doi: 10.1074/jbc.M109.097675. Epub 2010 Feb 5. J Biol Chem. 2010. PMID: 20139089 Free PMC article.
-
Role of Cl- channels in primary brain tumour.Cell Calcium. 2019 Jul;81:1-11. doi: 10.1016/j.ceca.2019.05.004. Epub 2019 May 14. Cell Calcium. 2019. PMID: 31129471 Review.
-
Mechanisms of cellular synchronization in the vascular wall. Mechanisms of vasomotion.Dan Med Bull. 2010 Oct;57(10):B4191. Dan Med Bull. 2010. PMID: 21040688 Review.
Cited by
-
The emerging role of CaMKII in cancer.Oncotarget. 2015 May 20;6(14):11725-34. doi: 10.18632/oncotarget.3955. Oncotarget. 2015. PMID: 25961153 Free PMC article. Review.
-
Overexpression of CLC-3 is regulated by XRCC5 and is a poor prognostic biomarker for gastric cancer.J Hematol Oncol. 2018 Sep 14;11(1):115. doi: 10.1186/s13045-018-0660-y. J Hematol Oncol. 2018. PMID: 30217218 Free PMC article.
-
Prognostic value of ion channel genes in Chinese patients with gliomas based on mRNA expression profiling.J Neurooncol. 2017 Sep;134(2):397-405. doi: 10.1007/s11060-017-2539-0. Epub 2017 Jul 27. J Neurooncol. 2017. PMID: 28752501
-
A three ion channel genes-based signature predicts prognosis of primary glioblastoma patients and reveals a chemotherapy sensitive subtype.Oncotarget. 2016 Nov 15;7(46):74895-74903. doi: 10.18632/oncotarget.12462. Oncotarget. 2016. PMID: 27713134 Free PMC article.
-
Identification of a Prognostic Microenvironment-Related Gene Signature in Glioblastoma Patients Treated with Carmustine Wafers.Cancers (Basel). 2022 Jul 14;14(14):3413. doi: 10.3390/cancers14143413. Cancers (Basel). 2022. PMID: 35884475 Free PMC article.
References
-
- Catacuzzeno L, Aiello F, Fioretti B, Sforna L, Castigli E, Ruggieri P, Tata AM, Calogero A, Franciolini F. Serum-activated K and Cl currents underlay U87-MG glioblastoma cell migration. J Cell Physiol. 2011;226:1926–1933. - PubMed
Publication types
MeSH terms
Substances
Grants and funding
LinkOut - more resources
Full Text Sources
Other Literature Sources
Miscellaneous