. 2013 Jan 23;33(4):1552-63.
doi: 10.1523/JNEUROSCI.3410-12.2013.

Interglomerular lateral inhibition targeted on external tufted cells in the olfactory bulb

Affiliations

Interglomerular lateral inhibition targeted on external tufted cells in the olfactory bulb

Jennifer D Whitesell et al. J Neurosci. .

Abstract

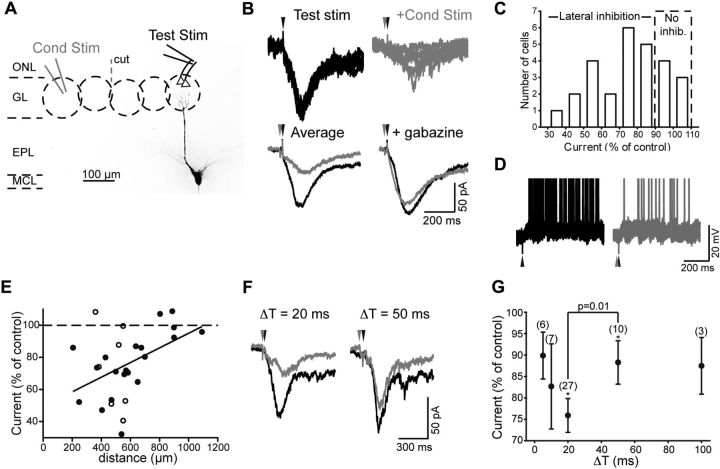
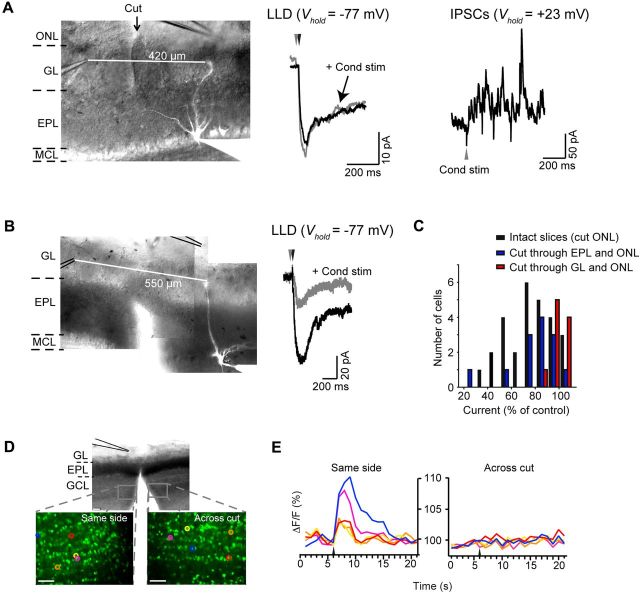
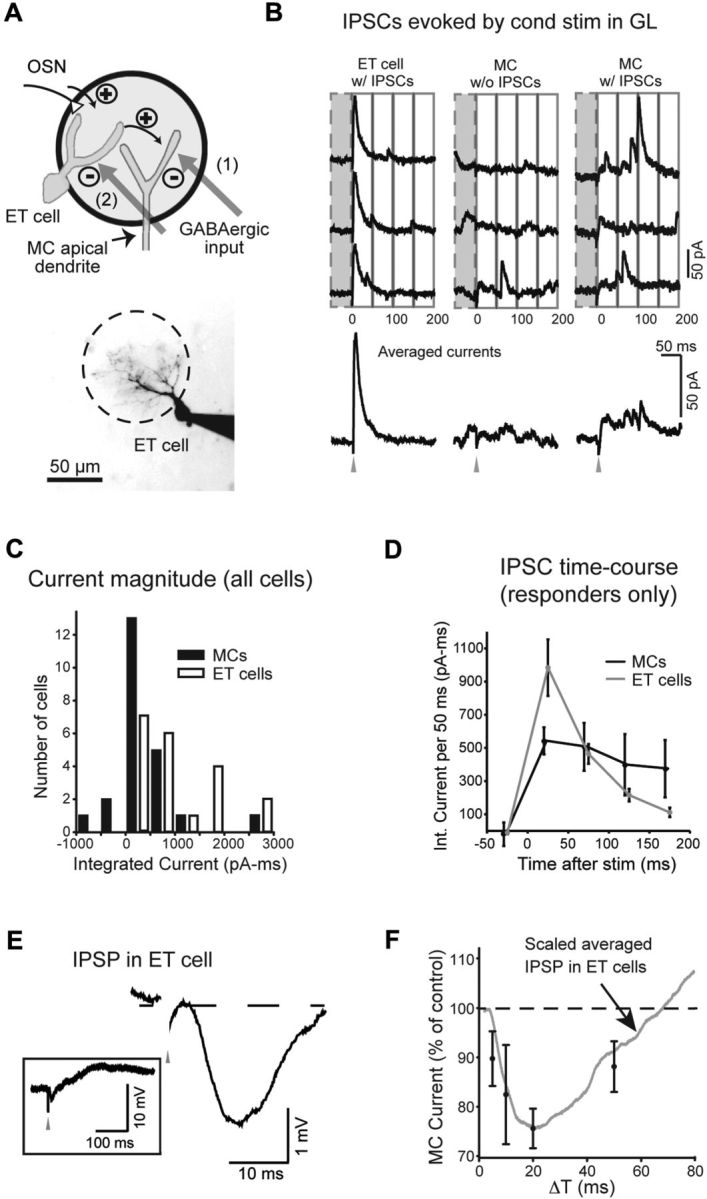
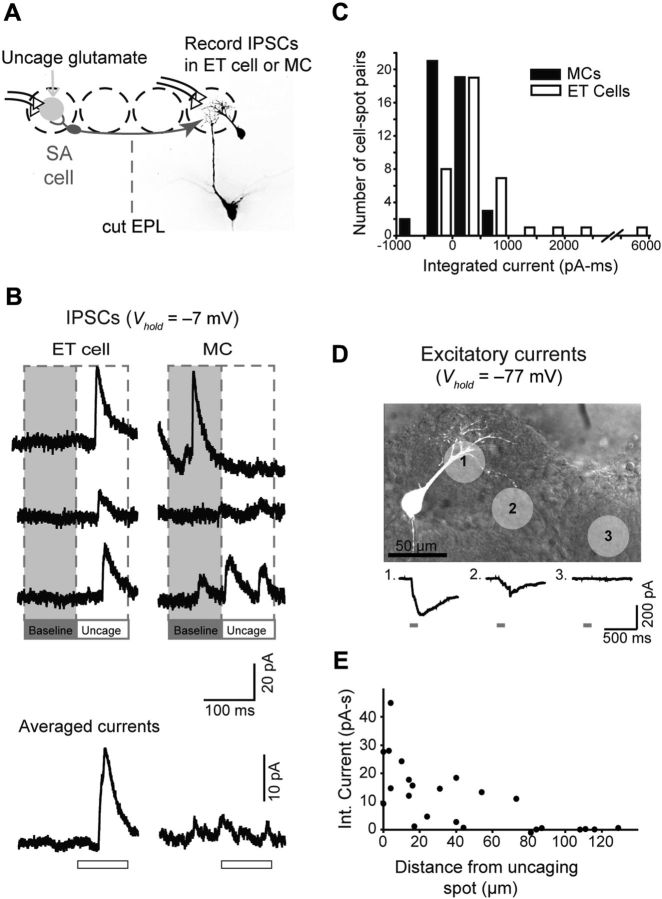
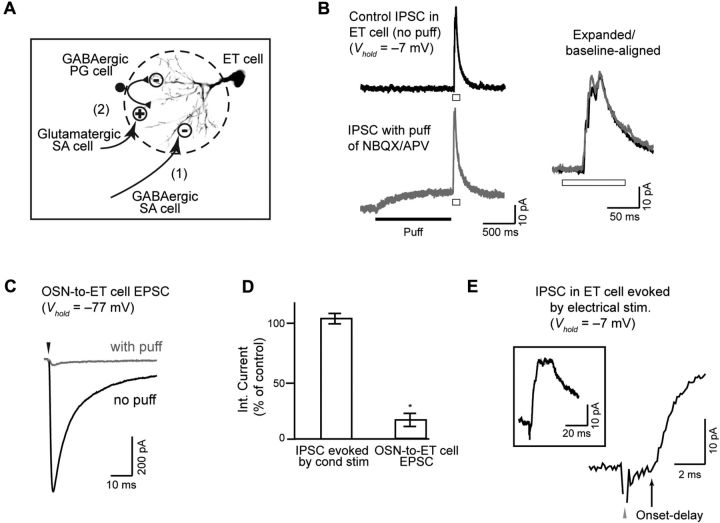
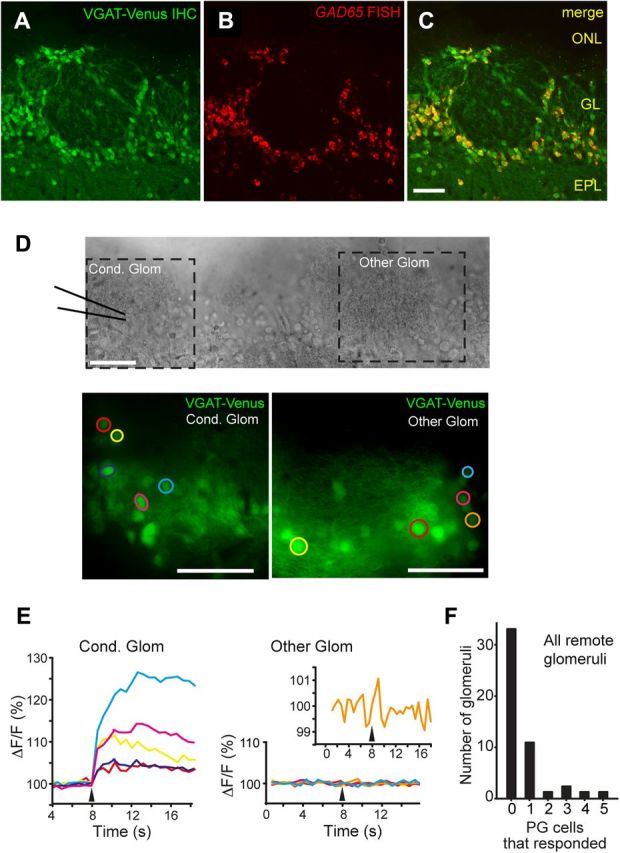
Lateral inhibition between neurons occurs in many different sensory systems, where it can perform such functions as contrast enhancement. In the olfactory bulb, lateral inhibition may occur between odorant receptor-specific glomeruli that are linked anatomically by GABAergic granule cells (GCs) and cells within the glomerular layer, although evidence supporting lateral inhibition at a functional level is modest. Here, we used patch-clamp, imaging, and glutamate uncaging methods in rat olfactory bulb slices to test for the presence of interglomerular lateral inhibition, as well as its underlying mechanisms. We found that a conditioning stimulus applied at one or a small group of glomeruli could suppress stimulus-evoked excitation of output mitral cells (MCs) at another glomerulus for interstimulus intervals of 20-50 ms and glomerular separations of up to 600 μm. The observed lateral inhibition was entirely dependent on circuitry within the glomerular layer, rather than GCs, and it involved GABAergic synaptic inputs that were targeted mainly onto tufted cells, which act as intermediaries in the excitation between olfactory sensory neurons and MCs. The key cell type responsible for mediating lateral interactions between glomeruli were GABAergic short-axon cells. These results suggest a functional segregation of GABAergic cells within the bulb, with one set located in the glomerular layer mediating suppression of MC spiking across glomeruli, and a second set, the GCs, synchronizing different glomeruli.


Figures

Figure 1.
Figure 1.
Lateral inhibition of LLDs in MCs. A, Experimental design. A test stimulus was applied to the ONL near the target glomerulus of the test MC (labeled with Alexa 488, 100 μm) to evoke an LLD. A conditioning stimulus was applied directly to a glomerulus 200–1200 μm from the target glomerulus (for this cell, 405 μm). ONL, Olfactory nerve layer; GL, glomerular layer; EPL, external plexiform layer; MCL, mitral cell layer. B, Recording from the MC in A showing that conditioning stimuli reduced the LLD current (measured at Vhold = −77 mV). Top, Five trials in response to test stimulation alone (left) or when a conditioning stimulus preceded test stimulation by 20 ms (right; ΔT = 20 ms). The gray and black arrowheads indicate times of conditioning and test stimulation, respectively. Bottom left, Average response from all trials in this cell (9 trials under each condition). Bottom right, Average currents for the same cell in response to test stimulation alone (black) or with a conditioning prestimulus (gray) in the presence of gabazine. C, Effect of conditioning stimulation on LLD current in 27 MCs for ΔT = 20 ms. The number of trials per experiment varied from 7 to 38. D, Example current-clamp recording from a MC, showing suppression of spike activity due to the conditioning stimulus (gray traces) compared with control (black). Four trials are shown overlaid under each condition. Spike peaks were truncated. E, Suppression of LLD current as a function of distance between conditioning and test stimuli. The diagonal line shows correlation between LLD inhibition and distance (R2 = 0.20; p = 0.02). The filled circles indicate experiments where the slice had a cut through the ONL between conditioning and test stimuli; the open circles were without a cut. Each data point in the plot reflects a separate recording. F, Comparison of LLD suppression in one MC for ΔT = 20 (left) or 50 ms (right). G, Dependence of lateral inhibition of the LLD on the time interval between conditioning and test stimulation. n values are shown for each interval. Inhibition (*p ≤ 0.03) was observed for both ΔT = 20 and 50 ms, although significantly less inhibition was observed for ΔT = 50 ms (p = 0.01).
Figure 2.
Figure 2.
A circuit in the glomerular layer mediates lateral inhibition. A, Sectioning through the GL between the sites of conditioning and test stimulation abolished interglomerular LLD suppression. The DIC image at left (with fluorescent MC overlaid) shows the site of the cut through the GL and ON layers in an experiment in which the two stimulating electrodes were 420 μm apart. At middle are the averaged data traces recorded without (black) and with (gray) a conditioning stimulus. At right are IPSCs recorded in the same MC in response to the conditioning stimulus alone (isolated at Vhold = +23 mV). The presence of IPSCs indicates that this MC received substantial GABAergic synaptic input from GCs but that the inhibition did not suppress the LLD. B, Significant suppression of the LLD occurred in a slice in which the EPL was sectioned. C, Histogram summarizing LLD suppression for all recordings obtained in intact slices (cuts only through ONL) versus slices with cuts either through the EPL (blue) or GL (red). Histogram bars are shown in increments of 10%; the width of each bar was narrower to accommodate the three conditions on the same graph. Slices with cuts through the EPL or GL also included a cut through the ONL. D, E, Calcium imaging of fura 2 AM dye signals in the granule cell layer (GCL) was used to verify that cuts through the EPL greatly reduced excitation of GCs evoked by conditioning stimuli across the cut. Green in the fluorescence image in D reflects baseline fura-2 signal (elicited by 380 nm light) in the GCL on either the same side of the cut with respect to the stimulating electrode or across the cut. E, Representative GC responses (ΔF/F) on the same side (left) or across the cut (right). The arrows indicate time of stimulus. All scale bars: (in D), 50 μm.
Figure 3.
Figure 3.
ET cells are the primary recipients of the GABAergic synapses that underlie lateral inhibition of MCs. A, Top, Two possible targets of the GABAergic synaptic inputs include the apical dendrite of the MC itself (option 1) or ET cells, which mediate multistep excitation between OSNs and MCs (option 2). Bottom, ET cell used in the recording in B. B, Recording of IPSCs evoked by conditioning stimulation of distant glomeruli, used to determine the cell target of GABAergic synapses. Single-trial responses (top) and averaged responses (bottom) are shown for an ET cell that showed a strong evoked IPSC (left; Vhold = −7 mV) and MCs with (middle) and without (right) evoked IPSCs. MC recordings were made in slices with a cut through the EPL and ONL to ensure that evoked IPSCs originated in the GL. C, Histogram of baseline-subtracted integrated current measurements, summarizing the IPSC recordings in ET cells and MCs. Histogram bars are shown in increments of 500 pA · ms. The relatively large spread of the MC data around zero reflects noise in MC recordings due to spontaneous IPSCs. Conditioning stimuli were applied at distances >300 μm from the test cells in all experiments. D, Time course of evoked IPSCs in ET cells and MCs, in selected cells with evoked responses. Each point in plot reflects the average integrated current measured in 50 ms intervals centered at the indicated times. E, Current-clamp recording of the voltage response in an ET cell to a conditioning stimulus (prestimulus voltage, −58 mV), shown in expanded and nonexpanded (boxed) forms. Note the short-duration IPSP, which, in this cell, was followed by a longer-lasting EPSP. F, The IPSP in ET cells evoked by a conditioning stimulus (averaged across 6 ET cells) superimposed on plot relating suppression of the MC LLD with the time interval between conditioning and test stimulation (taken from Fig. 1G). The IPSP was scaled to peak at the current value for ΔT = 20 ms.
Figure 4.
Figure 4.
Glutamate uncaging evokes lateral IPSCs in ET cells but not MCs. A, Experimental design. IPSCs in MCs and ET cells were recorded in response to glutamate uncaging at a distant glomerulus (gray circle; recordings done in 100 μm MNI-glutamate, 35-μm-diameter laser pulse). The uncaged glutamate can excite SA cells in the conditioning glomerulus that project to the test glomerulus. MC recordings were done in slices with a cut through the EPL to isolate glomerular layer inhibition. B, Example current recordings (Vhold = −7 mV), showing an evoked IPSC in an ET cell (left) but not the MC (right). Three representative trials are shown at top, and averages are at bottom. The open bars below the averaged traces indicate the 100 ms laser pulse. The evoked IPSC in the ET cell occurred with a delay of ∼30 ms following the start of the laser pulse, presumably reflecting the time it takes for glutamate to accumulate and activate SA cells at the conditioning glomerulus, either directly or via a polysynaptic mechanism. C, Histogram summarizing baseline-subtracted current measurements made across 45 MC–laser spot pairs and 38 ET cell–laser spot pairs. D, The spatial spread of the laser-evoked glutamate transients was assessed by measuring excitatory currents in an ET cell directly evoked by the uncaged glutamate. The top image shows the ET cell, along with light spots applied at different locations. The bottom traces show evoked currents. E, Summary of evoked current amplitude versus distance between the light spot and the nearest dendritic process of the test cell. Recordings were obtained in six MCs and two ET cells.
Figure 5.
Figure 5.
ET cells receive inhibitory input from GABAergic SA cells. A, Two potential mechanisms for the source of GABAergic input onto ET cells that underlies lateral inhibition. GABAergic SA cells could provide direct inhibitory input onto ET cells (option 1) or glutamatergic SA cells could excite GABAergic PG cells that then inhibit ET cells (option 2). B, Recordings of IPSCs in an ET cell, evoked by glutamate uncaging at a distant conditioning glomerulus (at open bars), used to discriminate the two mechanisms in A. Local puff application of glutamate receptor blockers (20 μm NBQX, 100 μm dl-APV) at the target glomerulus of the ET cell failed to reduce the IPSC, consistent with a mechanism of inhibition involving GABAergic SA cells. Data traces are displayed in nonexpanded (left) and expanded (right) forms. Note at bottom left that the puff of antagonists did impact the ET cell current before the laser pulse, indicating that glutamate receptor activation contributed to the baseline current. C, Puffs of NBQX and APV greatly reduced the EPSC due to monosynaptic OSN-to-ET cell transmission, evoked by local stimulation of OSNs at the target glomerulus of the ET cell (40 μA, 100 μs). These results control for possible inadequate drug penetration of target glomeruli in the puffer experiments. D, Summary of effects of puff-applied NBQX and APV on the IPSC evoked by conditioning stimulation of a distant glomerulus or the monosynaptic OSN-to-ET cell EPSC. Asterisk denotes a significant (p = 0.04) reduction due to the puff. E, The IPSC in the ET cell evoked by electrical stimulation at a conditioning stimulus (300 μA, 100 μs) had a short onset delay, further consistent with a mechanism involving direct inputs from GABAergic SA cells. The onset delay in this experiment was 2.2 ms.
Figure 6.
Figure 6.
Few PG cells are excited by conditioning stimulation of other glomeruli. A–C, Overlap in Venus and GAD65 signals in the glomerular layer of OB. A, Venus immunohistochemistry (IHC) (GFP antibody). B, GAD65 RNA fluorescent in situ hybridization (FISH). C, Overlay. D, E, Measurements of calcium signals (fura-2 AM) in Venus-positive putative PG cells in response to stimulation of a conditioning glomerulus (300 μA, 100 μs). D shows the DIC image (top) and VGAT-Venus fluorescence (native) image (bottom) of the conditioning glomerulus upon which the stimulating electrode was placed and another glomerulus. E shows the calcium responses (ΔF/F) of putative PG cells taken from the two glomeruli shown in D. Note the much larger responses from PG cells at the conditioning glomerulus. At the other glomerulus, one cell (orange trace) was a responder, based on our statistical analysis (see Materials and Methods), but the response was very weak. F, Summary of counts of PG cells that responded to the conditioning stimulus. Data were taken from 49 glomeruli located two to six glomerular widths (∼160–480 μm) from the stimulating pipette. Most glomeruli contained no responding PG cells. All scale bars, 50 μm.

Similar articles

Cited by

References

    1. Arevian AC, Kapoor V, Urban NN. Activity-dependent gating of lateral inhibition in the mouse olfactory bulb. Nat Neurosci. 2008;11:80–87. - PMC - PubMed
    1. Aungst JL, Heyward PM, Puche AC, Karnup SV, Hayar A, Szabo G, Shipley MT. Centre-surround inhibition among olfactory bulb glomeruli. Nature. 2003;426:623–629. - PubMed
    1. Balu R, Pressler RT, Strowbridge BW. Multiple modes of synaptic excitation of olfactory bulb granule cells. J Neurosci. 2007;27:5621–5632. - PMC - PubMed
    1. Bathellier B, Buhl DL, Accolla R, Carleton A. Dynamic ensemble odor coding in the mammalian olfactory bulb: sensory information at different timescales. Neuron. 2008;57:586–598. - PubMed
    1. Bozza TC, Mombaerts P. Olfactory coding: revealing intrinsic representations of odors. Curr Biol. 2001;11:R687–R690. - PubMed

Publication types

LinkOut - more resources