. 2013 Jan 23;33(4):1564-76.
doi: 10.1523/JNEUROSCI.3088-12.2013.

Selective ablation of pillar and deiters' cells severely affects cochlear postnatal development and hearing in mice

Affiliations

Selective ablation of pillar and deiters' cells severely affects cochlear postnatal development and hearing in mice

Marcia M Mellado Lagarde et al. J Neurosci. .

Abstract

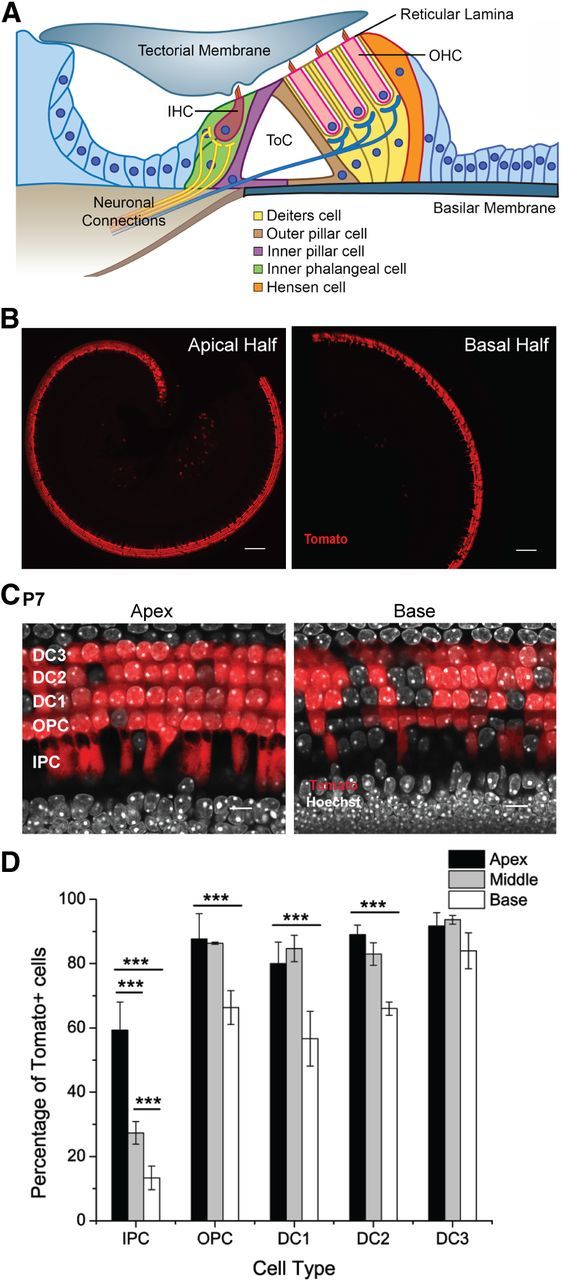
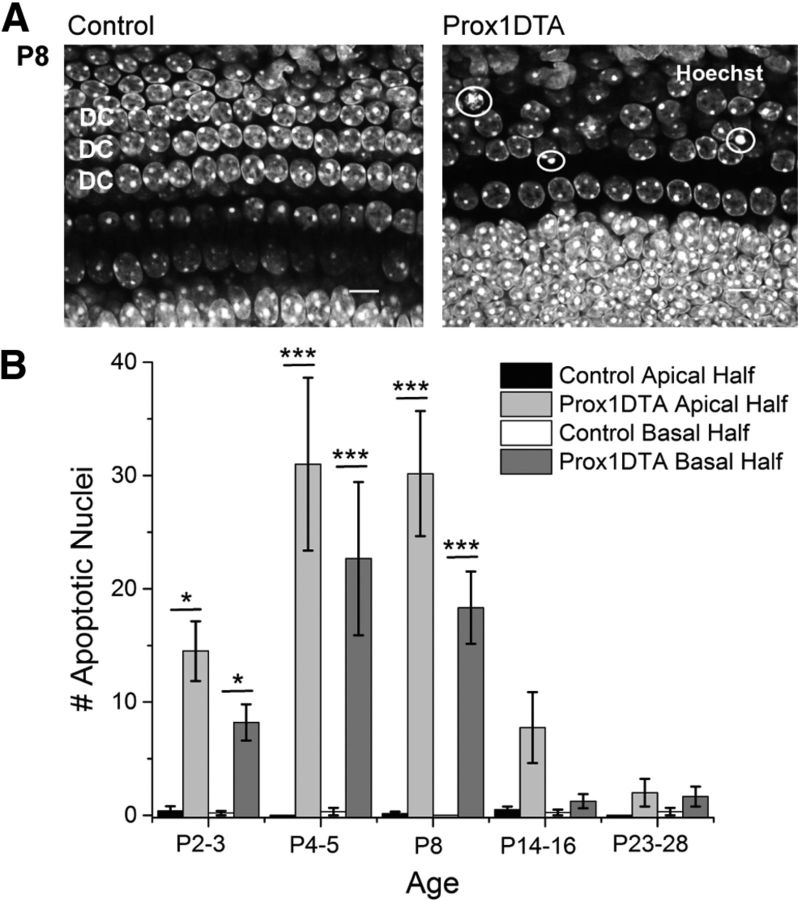
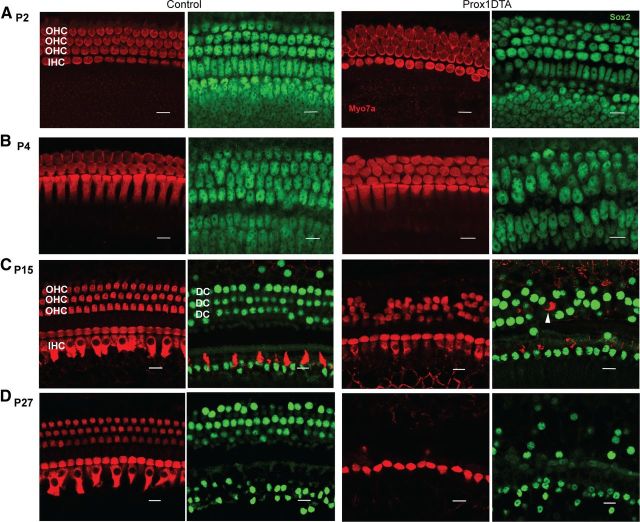
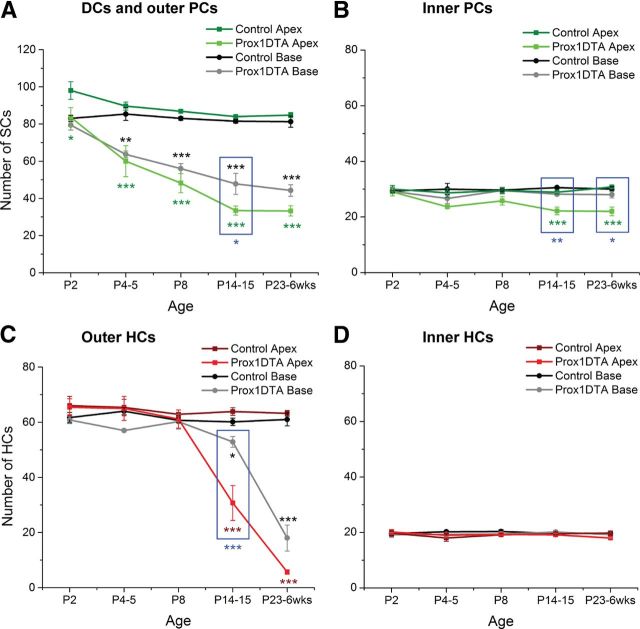
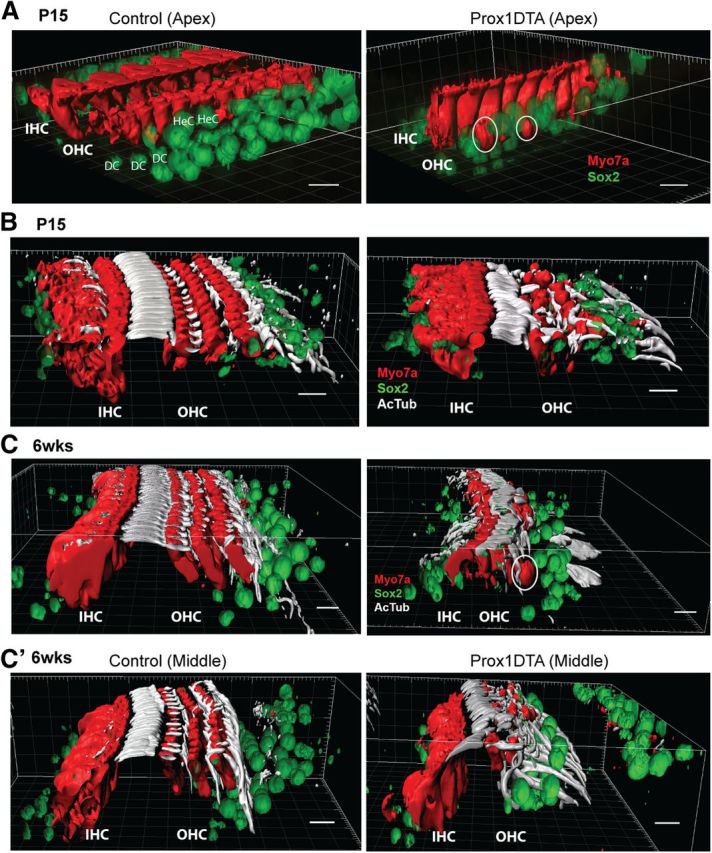
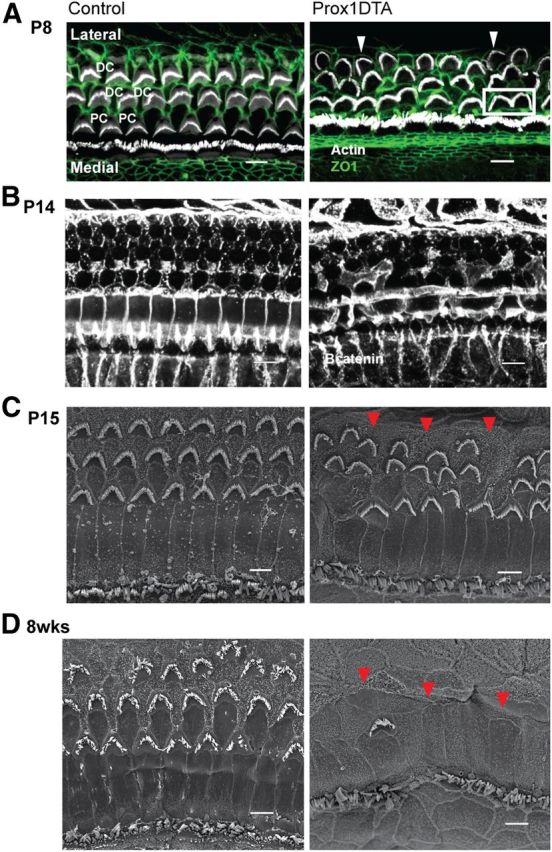
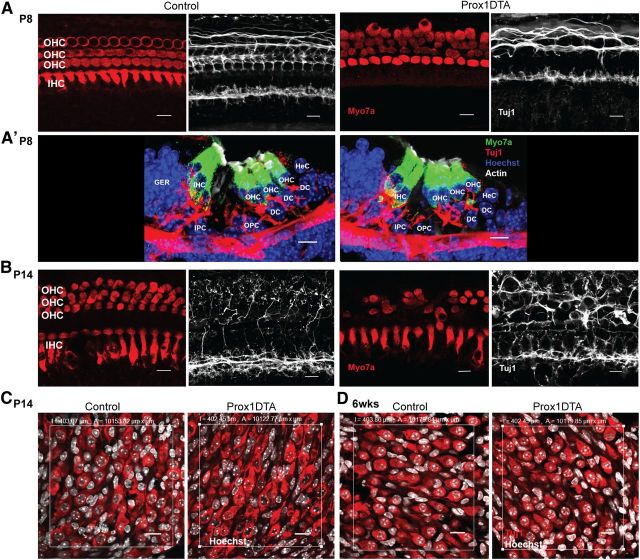
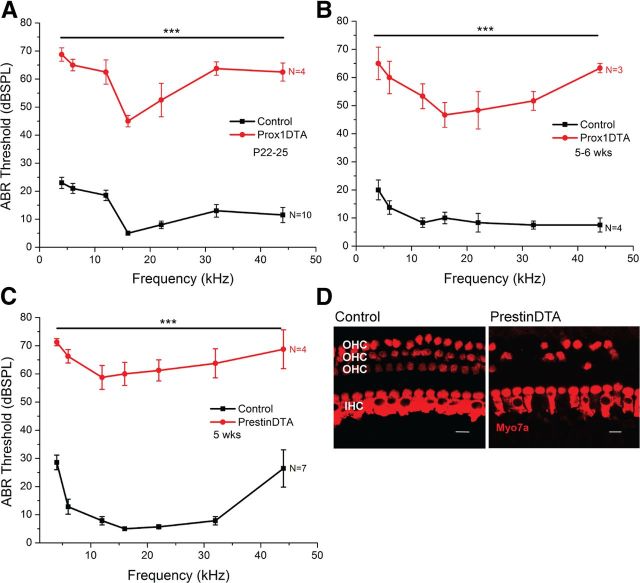
Mammalian auditory hair cells (HCs) are inserted into a well structured environment of supporting cells (SCs) and acellular matrices. It has been proposed that when HCs are irreversibly damaged by noise or ototoxic drugs, surrounding SCs seal the epithelial surface and likely extend the survival of auditory neurons. Because SCs are more resistant to damage than HCs, the effects of primary SC loss on HC survival and hearing have received little attention. We used the Cre/loxP system in mice to specifically ablate pillar cells (PCs) and Deiters' cells (DCs). In Prox1CreER(T2)+/-;Rosa26(DTA/+) (Prox1DTA) mice, Cre-estrogen receptor (CreER) expression is driven by the endogenous Prox1 promoter and, in presence of tamoxifen, removes a stop codon in the Rosa26(DTA/+) allele and induces diphtheria toxin fragment A (DTA) expression. DTA produces cell-autonomous apoptosis. Prox1DTA mice injected with tamoxifen at postnatal days 0 (P0) and P1 show significant DC and outer PC loss at P2-P4, that reaches ∼70% by 1 month. Outer HC loss follows at P14 and is almost complete at 1 month, while inner HCs remain intact. Neural innervation to the outer HCs is disrupted in Prox1DTA mice and auditory brainstem response thresholds in adults are 40-50 dB higher than in controls. The hearing deficit correlates with loss of cochlear amplification. Remarkably, in Prox1DTA mice, the auditory epithelium preserves the ability to seal the reticular lamina and spiral ganglion neuron counts are normal, a key requirement for cochlear implant success. In addition, our results show that cochlear SC pools should be appropriately replenished during HC regeneration strategies.


Figures

Figure 1.
Figure 1.
Prox1CreERT2 expression pattern in the organ of Corti revealed by the Ai14 (Rosa26-CAG-loxP-stop-loxP-tdTomato) reporter. A, Scheme of a cochlear cross section showing the relative position of HCs and SCs within the organ of Corti. The wild-type, mature organ of Corti has one row of inner HCs (IHC) and three rows of outer HCs (OHC) separated by one row of inner PCs and one row of outer PCs that form the tunnel of Corti (ToC). Deiters' cells connect the OHCs to the basilar membrane and extend phalanges to the reticular lamina reaching 2–3 OHCs away and leaving spaces around them (spaces of Nuel). Inner phalangeal cells surround the inner HCs. Hensen cells contact DCs at the lateral edge of the organ of Corti. Cell nuclei are depicted as blue circles and show that PC and DC nuclei are beneath HC nuclei. B, Representative optical sections taken at low magnification from the apical and basal halves of a Prox1Ai14 cochlea at P7 showing Tomato (red) expression in cochlear SCs along the turn. Scale bars, 100 μm. C, Representative optical sections of apical and basal regions of the cochleae of Prox1Ai14 mice at P7 using a higher magnification showing Tomato+ PCs and DCs. Scale bars, 10 μm. D, Quantification of Tomato+ SCs as a percentage of the total number of cells for each specific type. Statistical differences in the percentage of cells labeled between turns were determined by a two-way ANOVA followed by Student's t test with Bonferroni correction (***p < 0.001, N = 3). There are no significant differences in the percentages of labeled cells between apex and middle for outer PCs and DCs. IPC, inner PC; OPC, outer PC; DC1–3, Deiters' cells from rows 1–3 with row 1 being the closest to the inner HCs.
Figure 2.
Figure 2.
Apoptosis of PCs and DCs occurs in Prox1DTA mice after DTA expression. A, Representative optical sections of the apical cochlea at P8 of a Prox1DTA and of a control mouse. Images taken at the level of the PC and DC nuclei show examples of apoptotic nuclei with condensed chromatin in the Prox1DTA cochlea (white circles). Nuclei are labeled with Hoechst 33342 (white). Scale bars, 10 μm. B, Number of apoptotic PC and DC nuclei in the apical half and basal half of the cochleae of Prox1DTA and control mice observed at the time of cochlea harvesting (ages between P2 and P28). Data are expressed as mean ± SEM for N = 3–6 at each age. Statistical differences between counts in Prox1DTA and control cochleae at apex or base are represented with bars and asterisks (two-way ANOVA followed by Bonferroni correction, *p < 0.05, ***p < 0.001). There are no statistical differences between Prox1DTA and control at apex or base at P14 and later ages (p > 0.05). There are no statistical differences between Prox1DTA apical and basal counts at any age analyzed (p > 0.05).
Figure 3.
Figure 3.
PC and DC loss in Prox1DTA mice is progressive and followed by outer HC loss. A–D, Representative optical sections from the apical cochleae of Prox1DTA and control mice at the HC layer (Myo7a+ bodies in red) and the SC nuclear layer (Sox2+ nuclei in green). Side-by-side images show HCs and SCs underneath in control and Prox1DTA cochleae at ages P2 (A), P4 (B), P15 (C), and P27 (D). The number of PCs and DCs (green nuclei) decreased between P2 and P27 in Prox1DTA mice. Outer HC (OHC) loss is evident at P15 and increases with age. Inner HCs (IHC) are present at all ages. White arrowhead in C represents an outer HC missing in the HC layer and found in the SC nuclear layer underneath. Scale bars, 10 μm.
Figure 4.
Figure 4.
Quantification of progressive SC and HC loss with age in Prox1DTA mice. A–D, Total numbers of SCs (Sox2+ nuclei) and HCs (Myo7a+ cell bodies) in 160 μm regions of the apical and the basal turns of the cochlea in Prox1DTA and control mice at different ages. Data are expressed as mean ± SEM (N = 3–8). Comparisons between cell counts in each Prox1DTA cochlear turn and corresponding controls were performed using a two-way ANOVA followed by Student's t test with Bonferroni correction (*p < 0.05, **p < 0.01, ***p < 0.001). Green or red asterisks show statistical differences between apical counts of SCs or HCs and their controls. Black asterisks represent differences between basal counts of SCs or HCs and their controls. Significant differences between apical and basal counts in Prox1DTA cochleae are marked with blue asterisk and highlighted inside blue squares.
Figure 5.
Figure 5.
Changes in organ of Corti 3D structure caused by PC and DC loss in Prox1DTA mice. A, Imaris 3D surface reconstruction of representative confocal images taken from Prox1DTA and control apical cochleae at P15. Inner and outer HCs (IHC and OHC) are shown in red (Myo7a) and SC nuclei in green (Sox2). White circles show outer HCs whose bodies only appear in the SC nuclei layer. Hensen cell (HeC) nuclei at the lateral edge of the organ of Corti in control mice are closer to the inner HCs in Prox1DTA mice. Scale bars, 10 μm. B, Imaris 3D surface reconstruction of HCs (red, Myo7a), SC nuclei (green, Sox2), and PC and DC phalanges labeled with acetylated tubulin (AcTub, white) in Prox1DTA and control apical cochleae at P15. Reduction in number of outer HCs and in number and organization of PC and DC phalanges is evident in Prox1DTA compared with control cochleae. The space between inner HCs and outer HCs is preserved. Scale bars, 10 μm. C, Imaris 3D surface reconstruction of HCs (red), SC nuclei (green), and PC and DC phalanges (white) in control and Prox1DTA apical cochleae at 6 weeks (6 wks). Fewer outer HCs are present at this age and the space between inner and outer HCs is reduced. White circle shows an outer HC body among SC nuclei. C', The middle turn in the same cochlea (6 weeks) shows more PC and DC phalanges present and conserved space between inner and outer HCs. Scale bars, 10 μm.
Figure 6.
Figure 6.
Progressive changes at the reticular lamina in Prox1DTA mice. A, Representative optical sections showing HC hair bundles (actin/phalloidin, white) and apical junctions between HCs and SCs (ZO1, green). Radial misorientation of hair bundles (white arrowheads) and HC–HC contacts (white square) are evident in Prox1DTA cochleae at P8, before outer HC loss occurs. ZO1 labeling at P8 shows disorganized and missing DC phalanges between outer HCs in Prox1DTA mice compared with controls. Scale bars, 5 μm. B, Representative projections of optical sections taken at the top of the organ of Corti of Prox1DTA and control cochleae. Apical junctions, labeled with β-catenin (white), are present in Prox1DTA mice at P14. Scale bars, 10 μm. C, D, Representative SEM images of the apical turn of the cochlea at P15 (C) and 8 weeks (D, 8 wks) of age from Prox1DTA and control mice. Note that the remaining PCs, DCs, and the Hensen cells seal the epithelium in Prox1DTA mice. Loss of outer HCs and misorientation of outer HC hair bundles are evident in Prox1DTA mice compared with controls at P15 (C). Progressive outer HC loss and preservation of inner HCs can be seen in Prox1DTA cochleae. Red arrowheads point to the tops of Hensen cells that have moved toward the inner HCs in Prox1DTA mice. Scale bars, 5 μm.
Figure 7.
Figure 7.
Neural connections to outer HCs are disrupted in Prox1DTA mice while neuronal cell bodies are preserved. A, Representative optical projections of the apical cochlea of Prox1DTA and control mice at P8. Side-by-side images show HC bodies (Myo7a, red) and neuronal connections in the same region (Tuj1, white). Prox1DTA cochleae show disorganized connections in the outer HC (OHC) area at P8. A', Cross sections of the organ of Corti of control and Prox1DTA mice showing a missing DC in Prox1DTA and corresponding disorganized innervation to the OHCs above. OHCs stay connected to the reticular lamina at this age. Scale bars, 10 μm. IHC, inner hair cell; IPC, inner PC; OPC, outer PC; GER, greater epithelial ridge; HeC, Hensen cell. B, Representative optical projections of the apical cochlea of Prox1DTA and control mice at P14. Tuj1 (white) staining of dendritic terminals shows refinement of connections to OHCs (Myo7a, red) between P8 and P14 in control mice and disruption of this pattern in Prox1DTA mice. Swelling of neuronal connections is also evident at this age in the outer HC region of Prox1DTA mice. Scale bars, 10 μm. C, Representative optical projections of the spiral ganglion region (area, 104 μm2) in cochlear cross sections at P14 showing similar numbers of neuronal bodies in control and Prox1DTA mice. Neuronal cytoplasm is labeled with Tuj1 (red) and nuclei with Hoechst (white). Scale bars, 10 μm. D, Representative optical projections of the spiral ganglion region (area, 104 μm2) in cochlear cross sections at 6 weeks (wks) showing similar numbers of neuronal bodies in control and Prox1DTA mice. Scale bars, 10 μm.
Figure 8.
Figure 8.
Increased ABR thresholds in Prox1DTA mice correlates with outer HC loss and absence of cochlear amplification. A, B, ABR (wave I) thresholds at frequencies 4–44 kHz of Prox1DTA and control littermate mice at P22–P25 (A) and at 5–6 weeks (wks) of age (B). Data are expressed as mean ± SEM. Thresholds are statistically different (40–50 dB) at all frequencies analyzed between Prox1DTA and control mice as determined by a two-way ANOVA followed by Student's t test with Bonferroni correction, ***p < 0,001). N values are shown on the side of each graph. C, ABR thresholds of 5-week-old PrestinDTA mice (where specific ablation of outer HCs was induced by tamoxifen injection at P21–P22). Statistically significant increase in thresholds (∼50 dB) are seen in PrestinDTA mice relative to control littermates as determined by a two-way ANOVA followed by Student's t test with Bonferroni correction, ***p < 0,001. There are no significant differences in ABR thresholds between PrestinDTA and Prox1DTA mice (two-way ANOVA followed by Bonferroni correction, p > 0.05). D, Representative optical slices of apical cochlea of PrestinDTA and control littermate mice at 5 weeks of age showing considerable loss of outer HCs (OHC) in the mutant mice. IHC, inner HC. Scale bars, 10 μm.

Similar articles

Cited by

References

    1. Abe T, Kakehata S, Kitani R, Maruya S, Navaratnam D, Santos-Sacchi J, Shinkawa H. Developmental expression of the outer hair cell motor prestin in the mouse. J Membr Biol. 2007;215:49–56. - PMC - PubMed
    1. Abrahamsen B, Zhao J, Asante CO, Cendan CM, Marsh S, Martinez-Barbera JP, Nassar MA, Dickenson AH, Wood JN. The cell and molecular basis of mechanical, cold, and inflammatory pain. Science. 2008;321:702–705. - PubMed
    1. Abrashkin KA, Izumikawa M, Miyazawa T, Wang CH, Crumling MA, Swiderski DL, Beyer LA, Gong TW, Raphael Y. The fate of outer hair cells after acoustic or ototoxic insults. Hear Res. 2006;218:20–29. - PubMed
    1. Ahmad M, Bohne BA, Harding GW. An in vivo tracer study of noise-induced damage to the reticular lamina. Hear Res. 2003;175:82–100. - PubMed
    1. Barclay M, Ryan AF, Housley GD. Type I vs type II spiral ganglion neurons exhibit differential survival and neuritogenesis during cochlear development. Neural Dev. 2011;6:33. - PMC - PubMed

Publication types

MeSH terms