. 2013 Jan 23;33(4):1598-614.
doi: 10.1523/JNEUROSCI.2541-12.2013.

Target-specific IPSC kinetics promote temporal processing in auditory parallel pathways

Affiliations

Target-specific IPSC kinetics promote temporal processing in auditory parallel pathways

Ruili Xie et al. J Neurosci. .

Abstract

The acoustic environment contains biologically relevant information on timescales from microseconds to tens of seconds. The auditory brainstem nuclei process this temporal information through parallel pathways that originate in the cochlear nucleus from different classes of cells. Although the roles of ion channels and excitatory synapses in temporal processing have been well studied, the contribution of inhibition is less well understood. Here, we show in CBA/CaJ mice that the two major projection neurons of the ventral cochlear nucleus, the bushy and T-stellate cells, receive glycinergic inhibition with different synaptic conductance time courses. Bushy cells, which provide precisely timed spike trains used in sound localization and pitch identification, receive slow inhibitory inputs. In contrast, T-stellate cells, which encode slower envelope information, receive inhibition that is eightfold faster. Both types of inhibition improved the precision of spike timing but engage different cellular mechanisms and operate on different timescales. Computer models reveal that slow IPSCs in bushy cells can improve spike timing on the scale of tens of microseconds. Although fast and slow IPSCs in T-stellate cells improve spike timing on the scale of milliseconds, only fast IPSCs can enhance the detection of narrowband acoustic signals in a complex background. Our results suggest that target-specific IPSC kinetics are critical for the segregated parallel processing of temporal information from the sensory environment.


Figures

Figure 1.
Figure 1.
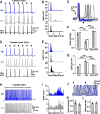
Glycinergic IPSCs show different decay time courses in bushy and T-stellate cells. A, Diagram of the CN circuit. Red, AN fibers (excitatory); blue, TBV tract (inhibitory); gray area, high-frequency region of AVCN. B, Image of a parasagittal CN slice. A cut between PVCN and DCN prevents antidromic stimulation of AN fibers. C, D, Typical current-clamp responses of bushy (C) and T-stellate (D) cells. E, eIPSCs in bushy cells (red) were blocked by strychnine (gray). Black line, Double-exponential fit to decay (τw is weighted time constant; see Materials and Methods). F, eIPSC of a T-stellate cell (blue) was blocked by strychnine (gray) and was fit with a single exponential (black). Traces in E and F are average of 60 responses. G, H, sIPSCs from bushy (red) and T-stellate (blue) cells were blocked by strychnine (gray; all traces in the presence of APV, CNQX, and TTX). Strychnine block of eIPSCs and sIPSCs was observed in 11 of 11 bushy cells and 10 of 10 T-stellate cells. Calibration in inset: 100 pA, 20 ms. I, Averaged sIPSCs from the cell in G (red, 923 events) and (H) (blue, 791 events), normalized to peak. Black traces, Fits of averaged bushy (red) and T-stellate (blue) sIPSCs with double and single exponentials, respectively. J, eIPSC and sIPSC decay kinetics are similar within, but different between, cell types. Unpaired t test: *p < 0.05, ***p < 0.001. K, Kinetics of single sIPSCs pooled from four T-stellate (blue, 1454 events) and six bushy (red, 744 events) cells. Different symbols represent different cells. Ctrl, Control; Stry, strychnine.
Figure 2.
Figure 2.
Glycine receptors in bushy and T-stellate cells have different single-channel conductances. A, Mean current and ensemble variance of 539 sIPSC events from a bushy cell. B, The variance-mean current plot from the cell in A was described by a parabolic curve, from which the mean single-channel conductance of the glycine receptors was estimated. C, D, Analysis of 461 sIPSC events from a T-stellate cell as in A and B. E, Summary of single-channel conductances in both cell types. Estimation of single-channel conductance was based on the driving force of 50 mV for chloride.
Figure 3.
Figure 3.
Comparison of IPSC versus EPSC kinetics. A, eIPSCs and eEPSCs from two example bushy cells (top) and two T-stellate cells (bottom). Each trace is an average of 30–50 trials, normalized to the peak current. The arrow indicates the time of stimulation. The stimulus artifact was removed. B, Example sIPSCs and sEPSCs obtained from an example bushy (top) and a T-stellate cell (bottom). The difference between EPSC and IPSC kinetics can be clearly seen in the same cells. E, sEPSC event; I, sIPSC event. No drugs were used to block excitatory or inhibitory receptors. Cs-based internal solution contained 35 mm chloride, so both EPSCs and IPSCs appear as inward currents.
Figure 4.
Figure 4.
Glycinergic transmission during repetitive stimulations. A, Example eIPSCs of a bushy and a T-stellate cell to 50-pulse stimulation at the DCN. Stimulus timing is indicated by tick marks above the traces. Dashed line, Baseline current; gray dot, IPSC “foot” current; black dot, IPSC peak current. The foot and peak IPSC are not labeled in 400 Hz traces for clarity. Cells were voltage clamped at −70 mV. B, Average summation ratio (foot/peak IPSC size) of the last 40 IPSCs in bushy and T-stellate cells. C, Current-clamp recordings of a bushy and a T-stellate cell to 50-pulse stimulation. Dashed line, Resting membrane potential (bushy, −54.8 mV; T-stellate, −50.3 mV); gray dot, IPSP foot potential; black dot, IPSP peak potential. D, Average summation ratio (foot/peak IPSP size) of the last 40 IPSPs in bushy and T-stellate cells. Voltage-clamp recordings (A, B) used Cs+-based internal solution with 35 mm Cl; current-clamp recordings (C, D) used K+-based internal solution (see Materials and Methods). Traces in A and C are averages of between 5 and 20 repetitions. The stimulus artifacts were removed from all traces. All recordings were made in the presence of APV and CNQX. Unpaired t test: ***p < 0.001.
Figure 5.
Figure 5.
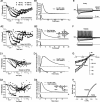
The role of glycinergic inhibition on temporal processing in bushy cells. A, Example responses of a bushy cell to 100 Hz stimulation at AN (excitation), DCN (inhibition), or both sites (excitation and inhibition) with DCN stimulation delayed 2 ms relative to AN. Stimulus onsets are indicated by the tick marks above the traces. The stimulus artifact was removed in all traces. B, Folded period histogram of spike peak latency during the last 40 stimuli, compiled over 10 repetitions, from the cell in A. Inhibition did not improve spike timing. C, Expanded view of the individual responses during the train to show spike jitter with (red) and without (gray) DCN inhibition. D, Summary of changes in vector strength for eight bushy cells. E, Summary of change in firing probability per stimulation. F, Responses of the same bushy cell as in A to 400 Hz stimulation at AN (excitation), DCN (inhibition), or both sites (excitation and inhibition). Tick marks above traces show stimulus timing. G, Folded period histogram of spike peak latency during the last 40 pulses of the trains from the cell in F, summed over 10 repetitions of the stimulus train. Spike jitter was reduced with inhibition. H, Example traces during the train to show spike jitter with (red) and without (gray) DCN inhibition. I, J, Responses of the bushy cell model to 400 Hz stimulation, in the same layout as in F and G. K, Inhibition improved vector strength of bushy cells in both experimental study (gray; exp) and computer model simulations (white; model). Same labels apply in L. L, Inhibition decreased firing probability. Paired t test: **p < 0.01, ***p < 0.001.
Figure 6.
Figure 6.
The role of glycinergic inhibition on temporal processing in T-stellate cells. A, Responses of a T-stellate cell to 100 Hz stimulation in control (blue), strychnine (gray), and strychnine plus APV (black). B, Folded period histogram of the spike peak latency. Data were from five 50-pulse trains under each condition. C, Example traces of a T-stellate cell during the train show that IPSPs in control (blue) prevented supernumerary spikes, as shown in gray, whereas inhibition was blocked by strychnine. IPSPs (arrowhead) were delayed by ∼2 ms relative to EPSPs. D, E, Responses of the T-stellate cell model to 100 Hz stimulation, in the same layout as in A and B. F, Blocking glycinergic inhibition decreased the vector strength of T-stellate cells, which was restored by additional block of NMDA-receptor-mediated currents. For experimental data: control (Ctrl) and strychnine (Stry), n = 15; strychnine plus APV, n = 6. For modeling data: n = 10 runs in each group. G, Blocking inhibition increased the firing probability, which was restored by additional block of NMDA-receptor-mediated currents. For experimental data: control and strychnine, n = 15; strychnine plus APV, n = 6. For modeling results: n = 10 runs in each group. H, Example responses of a T-stellate cell to 400 Hz stimulation under control (blue) or in the presence of strychnine (gray). I, Folded period histogram of spike times from the last 40 stimuli, accumulated over 10 trains, under each condition. J, Expanded view of individual responses of the T-stellate cell during the train. K, Summary change in vector strength for nine T-stellate cells. L, Summary change in spikes per stimulus for the same T-stellate cells. **p < 0.01, ***p < 0.001.
Figure 7.
Figure 7.
Fast and slow inhibition differentially affect spike thresholds. A, Maximum rising slope of an example EPSP from a bushy cell. Black, EPSP trace; gray, first derivative. B, Inhibition increased the maximum rising slopes of EPSPs that failed to trigger spikes during 400 Hz trains in an example bushy cell. Left, Scatter plot of EPSPs; right, histogram showing the distribution of maximum rising slopes; gray, with glycinergic inhibition (AN+DCN stim); black, without glycinergic inhibition (AN stim). Arrows indicate estimated threshold slope. C, Summary of threshold slopes from 10 bushy cells with and without inhibition. D, Spike threshold of an example T-stellate cell. Black, spike trace; gray, second derivative. E, Inhibition did not change the spike thresholds of an example T-stellate cell. Left, Scatter plot of spike threshold during the last 40 pulses of the train; right, histogram showing the distribution of spike thresholds; black, with inhibition [control (ctrl)]; gray, without inhibition [strychnine (stry)]. Arrows indicate average spike thresholds. F, Summary of average spike thresholds from 15 T-stellate cells.
Figure 8.
Figure 8.
Cellular and network models for bushy and T-stellate cells. A1, Example of rate-dependent depression and recovery for AN EPSCs in a bushy cell. Symbols, The time course of the release probability, Pr = F(t) × D(t) × F1, where F(t) is the facilitation term as a function of time [F(0) = 1.0], D(t) is the depression term[D(0) = 1.0], and F1 is the initial value that sets the release probability (from Table 1) of bushy cell EPSCs in response to stimulation of the AN. The lines are simultaneous fits of the kinetic model for all frequencies and time points for an individual cell. A2, Example of rate-dependent depression and recovery for TBV tract eIPSCs in a bushy cell. Lines indicate fits as in A1. B1, Fit of state models for bushy cell EPSCs to the time course of synaptic currents. Top axes, The “Exp fit to data” is from Equation 3, using the parameters in Table 3. The dashed line is the fit to the state model of Raman and Trussell (1992) (R&T Model fit), with the parameters given in Table 2. Bottom axes, Time course of the synaptic cleft glutamate transient associated with the fit. A2, The time course of bushy cell IPSCs was best fit by a six-state model with two open states. Inset, Six-state model (Gly6S). Top axes, The solid line (“Exp fit to data”) is from Equation 3, using the parameters in Table 3. The dashed line is from the model, with the parameters shown in Table 4. Bottom axes, Time course of the synaptic cleft glycine transient, estimated using Equation 1. C1, C2, The time course and fits of release probability for T-stellate cell EPSCs (C1) and IPSCs (C2) in the same layout as in A1 and A2. The kinetic parameters are listed in Table 1. D1, D2, Fits of state model for T-stellate cell EPSCs (D1) and IPSCs (D2). The panels are in the same layout as in B1 and B2, with the parameters given in Tables 2–4. For details of the fitting procedures, see Materials and Methods. E, F, Response of the bushy and T-stellate model cells (mouse parameters) to current injections, respectively. G, Current–voltage relationships of bushy and T-stellate cell model. Open symbols, Bushy cell; filled symbols, T-stellate cell; circles, steady-state voltage; squares, peak voltage. H, Firing rates of bushy and T-stellate cell model to current injections. Open symbols, Bushy cell model; filled squares, T-stellate cell model.
Figure 9.
Figure 9.
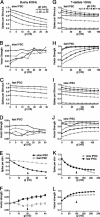
IPSC kinetics control temporal precision in simulated bushy and T-stellate cells. A, Parametric exploration of firing probability in bushy cell model for different combinations of excitatory (same symbols as in B) and inhibitory (abscissa) conductance levels for 400 Hz stimulus trains. Slow inhibition (τ = 11 ms) as observed experimentally in bushy cells was used. Spike probability was used to choose parameters shown in model simulation in Figure 5. B, Vector strength across the same parameter space as in A. C, Similar to A but using fast IPSC time course (τ = 1.3 ms) observed in T-stellate cells, in the bushy cell model. D, Vector strength across the same parameter space as in C. E, F, Firing probability and vector strength of the bushy cell model in response to 50-pulse stimulation at 400 Hz with either slow or fast IPSCs. Excitatory conductance used: gE = 50 nS. Arrowhead, The selected conductance levels used in Figure 5I–L. G, Parametric exploration of firing probability in T-stellate cell model for different combinations of excitatory (symbols as in H) and inhibitory (abscissa) conductance levels for 100 Hz stimulus trains. Fast inhibition (τ = 1.3 ms) observed experimentally in T-stellate cells was used. Spike probability was used to choose parameters shown in model simulations in Figure 6. H, Vector strength across the same parameter space as in G. I, J, Same as in G, H, except slow inhibition (τ = 11 ms) was used. K, L, Firing probability and vector strength of the T-stellate model in response to 50-pulse stimulation at 100 Hz with slow or fast IPSCs. Excitatory conductance used: gE = 8 nS. The arrowhead marks the conductance levels used in Figure 6D–G. Data are the mean and SEM of 10 independent runs of the model, using different seeds for the stochastic processes of transmitter release latency and release probability. SEs in E and K are small and masked by data symbols.
Figure 10.
Figure 10.
Fast inhibition is required for T-stellate cells to exhibit CMR. A1, Spectrogram of the REF stimulus, consisting of a masker (red) and a signal (blue), each amplitude modulated at 10 Hz. A2, PSTHs (5 ms bin width) showing responses in one trial across 25 T-stellate cells. Blue bars indicate timing of the signal. A3, PSTH with no signal. The signal elicits spikes (A2) during minima in the masker (A3). Ordinate spike rate is normalized per cell. n = total spike count. B1, Spectrogram for the CM condition. B2, PSTH as in A2. The cells fire primarily during the signal. B3, PSTH during CM condition with no signal. C1, CD condition, in which the flanking sidebands are not phase coherent with the masker. C2, PSTH of CD condition as in A2. C3, PSTH of CD condition with no signal. The cells fire primarily during the masker in both C2 and C3. D, Network schematic showing wideband AN inputs to the inhibitory D-stellate cell and on-frequency excitatory AN input to the target bushy or T-stellate cell. Synapses are marked with either open (excitatory) or filled (inhibitory) symbols. IC, Inferior colliculus. E, Detectability (d′) of the signal with changes in signal/masker ratio, for fast inhibition. CMR (relative to the CD condition) occurs for signal/masker ratios greater than −15 dB. Error bars are SDs of four runs with different random draws of network connectivity. F, Detectability, as in E with slow inhibition. The CM sounds fail to improve detectability of the signal. G, Detectability is best with fast IPSCs. For model details, see Materials and Methods.
Figure 11.
Figure 11.
Excitatory and inhibitory synaptic conductances during CMR as measured in T-stellate cell model. Data are shown for the CMR condition with a signal/masker ratio of 0 dB with 10 Hz modulation, as in Figure 10. A, Fast inhibition is driven by the off-frequency signals but it ceases rapidly in the valleys during the on-frequency signal (indicated by bars above the traces). The positive-going waveform is the total inhibitory conductance to the cell. The negative-going waveform is the total excitatory conductance to the cell. B, Cell spiking pattern for the trial shown in A shows firing increases during the release in inhibition, reflecting the drive from the on-frequency signal. C, Same format as A but with the fast inhibition replaced by slowly decaying inhibition. Although modulated by the off-frequency signals, the inhibition does not fully decay between cycles of the masker. D, Same format as B except with slow inhibition. Although the firing rate is modulated by the masker, the release during the signal is less clearly timed to the signal, and detection of the on-frequency signal is impaired.
Figure 12.
Figure 12.
Kinetics of IPSCs do not affect CMR in bushy cell model. Detectability of on-frequency signals in the presence of an on-frequency masker and flanking sidebands (same as in Fig. 10A1,B1,C1), for different signal/masker ratios, for model bushy cells. Although the flaking bands provide little improvement in detection for either fast or slow IPSCs relative to the REF condition, the signals are significantly masked in the presence of codeviant flanking bands. A, Using fast inhibition; B, using slow inhibition. Error bars are SDs.

References

    1. Altschuler RA, Betz H, Parakkal MH, Reeks KA, Wenthold RJ. Identification of glycinergic synapses in the cochlear nucleus through immunocytochemical localization of the postsynaptic receptor. Brain Res. 1986;369:316–320. - PubMed
    1. Arnott RH, Wallace MN, Shackleton TM, Palmer AR. Onset neurones in the anteroventral cochlear nucleus project to the dorsal cochlear nucleus. J Assoc Res Otolaryngol. 2004;5:153–170. - PMC - PubMed
    1. Awatramani GB, Turecek R, Trussell LO. Inhibitory control at a synaptic relay. J Neurosci. 2004;24:2643–2647. - PMC - PubMed
    1. Balakrishnan V, Trussell LO. Synaptic inputs to granule cells of the dorsal cochlear nucleus. J Neurophysiol. 2008;99:208–219. - PubMed
    1. Balakrishnan V, Kuo SP, Roberts PD, Trussell LO. Slow glycinergic transmission mediated by transmitter pooling. Nat Neurosci. 2009;12:286–294. - PMC - PubMed

Publication types

LinkOut - more resources