. 2013 Jan 23;33(4):1684-95.
doi: 10.1523/JNEUROSCI.2928-12.2013.

Gating of sensory input by spontaneous cortical activity

Affiliations

Gating of sensory input by spontaneous cortical activity

Artur Luczak et al. J Neurosci. .

Abstract

The activity of neural populations is determined not only by sensory inputs but also by internally generated patterns. During quiet wakefulness, the brain produces spontaneous firing events that can spread over large areas of cortex and have been suggested to underlie processes such as memory recall and consolidation. Here we demonstrate a different role for spontaneous activity in sensory cortex: gating of sensory inputs. We show that population activity in rat auditory cortex is composed of transient 50-100 ms packets of spiking activity that occur irregularly during silence and sustained tone stimuli, but reliably at tone onset. Population activity within these packets had broadly consistent spatiotemporal structure, but the rate and also precise relative timing of action potentials varied between stimuli. Packet frequency varied with cortical state, with desynchronized state activity consistent with superposition of multiple overlapping packets. We suggest that such packets reflect the sporadic opening of a "gate" that allows auditory cortex to broadcast a representation of external sounds to other brain regions.


Figures

Figure 1.
Figure 1.
Responses of individual cells and populations to sustained tone stimuli. A, Raster plots showing responses of four representative neurons to repeated presentations of a 1 s long 15 kHz tone (100 trials shown for each neuron). Red lines represent smoothed PSTHs, and the blue line underneath indicates the duration of a tone stimulus. B, A simulation of the structure of population activity expected if neurons were no more coordinated than predicted from the PSTHs. This plot was obtained by shuffling spikes of each cell between multiple stimulus presentations. C, Actual population activity on a single trial. The raster shows spikes of simultaneously recorded neurons and the blue trace shows local field potential. At bottom is the multiunit firing rate (MUA) computed as the smoothed summed activity of all neurons. Note that neurons tend to fire in transient bursts of 50–100 ms duration, with burst times including but not limited to tone onset.
Figure 2.
Figure 2.
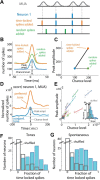
Population bursts have similar amplitude for onset, sustained, and spontaneous periods, but occur more reliably at stimulus onset. A, Top, Trial-averaged population rate triggered at tone onset. Bottom, Examples of population rate on three single trials. Note that activity packets occur reliably at tone onset, but sporadically during spontaneous and sustained periods. B, Box-and-whisker plots summarizing distributions of onset-evoked packets, and the distribution of amplitudes of the largest packets in the sustained and spontaneous periods. The central mark is the median, and the edges of the box are the 25th and 75th percentiles. C, Probability of occurrence of large activity packets (mean + 2 SD) during spontaneous, onset, and sustained periods.
Figure 3.
Figure 3.
Sustained preferred tones cause increased firing locked to spontaneous activity. A, Diagram illustrating how sustained tone presentation could affect an individual neuron's firing in the context of population activity. Gray curve (top) indicates population MUA rate. Blue indicates a hypothetical neuron's activity in the absence of sensory stimuli. Red indicates additional spikes due to tone presentation, locked to spontaneous MUA fluctuations. Green indicates additional spikes occurring at random times unrelated to spontaneous activity. B, CCGs between a single neuron and MUA, generated from data simulated according to the above scenarios. Adding random spikes (green) increases the CCG baseline level, but does not affect the area of the CCG peak, defined as the sum of activity above baseline level within the −50 to +50 ms time window. Adding the same number of spikes time locked to MUA (red) increases both the baseline level and the peak. C, Plotting peak amplitude versus baseline level results in positive slope if time-locked spikes are added, and zero slope for randomly added spikes. D, Example CCG between a recorded neuron and MUA, for its preferred tone and a nonpreferred tone. Dashed lines represent baseline levels calculated from trial-shuffled data. Note that the amplitude of the peak scales up as the baseline level increases, indicating addition of spikes time locked to MUA. E, Relationship between baseline level and peak amplitude for all neurons from one experiment. Each dot represents the response of one neuron to one tone, with colors indicating different neurons, and lines fitted for each neuron by linear regression. Inset, Histogram of regression slopes across all experiments (blue bars) and from trial-shuffled data (gray bars). F, Fraction of time-locked spikes across all experiments during sustained periods of tone presentations. Gray line shows trial-shuffled data. G, The same plot as in F but for spontaneous periods.
Figure 4.
Figure 4.
Temporal relationships between neurons are conserved across conditions. A, The timing of each neuron relative to the population was summarized by a μcc measure, computed as the center of mass of the scaled spike triggered MUA (CCG). The CCG shown has a rightward skew, indicating that this neuron fired at the beginning of periods of elevated population activity. B, The μcc measure for each neuron calculated during sustained tone responses and during spontaneous activity. Neurons from different animals are shown with different colors. The distribution of points along the equality line shows that each neuron's temporal relationship to the population is preserved across conditions. C, Comparison of μcc for onset responses and sustained periods. D, Pseudocolor representation of CCGs for all neurons of a representative experiment, in three conditions. Each horizontal line of the pseudocolor matrix corresponds to the CCG of one neuron, vertically arranged in the same order for each plot, according to the value of μcc in the sustained period. For visualization, CCGs are normalized to mean 0 and unit variance. E, Line plot of normalized CCGs for the neurons with the smallest (red) and largest (green) values of μcc. To illustrate stability of CCGs within an experimental condition, two curves are superimposed for each cell, showing CCGs calculated from 50% of trials in each condition.
Figure 5.
Figure 5.
Effect of tone frequency on temporal fine structure during sustained period. A, Examples of how tone frequency affects the cross-correlogram between a single neuron's spikes and summed population activity. The three panels show data for three representative neurons. The six colors in each panel represent CCGs computed in the sustained periods of six different tone frequencies, with solid and dashed curves showing CCGs computed independently from two halves of the data set to illustrate reliability. The solid and dashed gray lines show the values of μcc as a function of frequency for the two halves. Note that timing differences between neurons are larger than differences between frequencies for a single neuron, but the latter also consistently occur. B, To quantify the modulation of CCG shape by tone frequency, we compared the similarity of CCG shapes for a single frequency between two halves of the data set, relative to similarity between different frequencies. The green histogram shows this quantity averaged over cells, for 100 different random splits of the data set, indicating that CCG shapes differ significantly between frequencies. The gray histogram shows a control analysis performing the same procedure after tone identity was shuffled. C, Sequential structure of sustained population activity depends on tone frequency. Sequential similarity was measured as the correlation coefficient of μcc across the population (Fig. 4B,C) for all pairs of tone frequencies. Note that greatest similarity is seen between responses to different presentations of the same frequency (distance 0), whereas a smaller but nonzero similarity is seen for widely separated tone frequencies (distance 5). D, The same analysis computed after trial shuffling to remove interactions between cells (Fig. 1B). After shuffling, sequence similarity is zero for all tone distances.
Figure 6.
Figure 6.
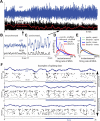
Effect of cortical state on sustained-period activity. A, Raw LFP trace (blue) and MUA firing rate (black) during several minutes of acoustic silence. Red curve shows the “state index,” defined as the percentage of time bins for which MUA rate was nonzero. B, C, Expanded views from the periods marked by arrows. The dashed horizontal line indicates a zero MUA rate. D, Histogram of instantaneous MUA rates during sustained tone responses, for desynchronized and synchronized trials. Dotted lines indicate the same analysis for trial-shuffled data. E, Comparison of MUA rate histograms for the sustained (200 ms to 1 s) period of tone presentation (solid lines) and for spontaneous activity (dashed). F, Examples of single-trial raster plots sorted by cortical state (conventions as in Fig. 1C). Activity during desynchronized states shows weaker global fluctuations but still exhibits complex fine structure.
Figure 7.
Figure 7.
Firing rates are modulated by both state and stimuli, but temporal constraints are conserved across states. A, Raster plots showing responses of a neuron to 100 repetitions of each tone, arranged by presentation order. Colored lines denote sustained epochs used for later analysis. B, Rasters of the same neuron's activity sorted by firing rate to reveal trial-to-trial variability in response rates. Data are shown for spontaneous periods, and for the sustained periods of 24 kHz tones (that did not evoke sustained rate increase) and 5.4 kHz tones (that did). C, Correlation of the same neuron's mean firing rate with cortical state, for the same three conditions as in B. D, Histogram of correlation coefficients between cortical state and firing rate for all neurons and all tones. Correlations for sustained tone responses (blue) and spontaneous epochs (green) are similar to each other, but differ from trial-shuffled data (gray). E, The μcc measure for each neuron calculated during sustained tone responses, in synchronized and desynchronized trials. Neurons from different animals are shown with different colors. The distribution of points along the equality line shows that each neuron's temporal relationship to the population is preserved across states. F, CCGs calculated during synchronized and desynchronized periods, sorted in the same vertical order. G, Corresponding examples of CCGs with the smallest (red) and largest (green) μcc measures, as in Figure 4E.
Figure 8.
Figure 8.
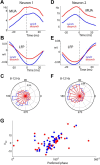
Phase relationship of spike timing to LFP mirrors timing relationship to population activity. A, Spike-triggered MUA histogram for an example neuron, computed in the synchronized (blue) and desynchronized (red) states. B, Spike-triggered LFP for the same neuron. Note that the (negative) peaks of these curves occur at a similar time to the peaks of the spike-triggered MUA in A. C, Histogram of spike phases for the same neuron with respect to LFP filtered in the 8–12 Hz frequency band in synchronized (blue) and desynchronized (red) states; note the similar phase preference across states, but deeper modulation in the synchronized state. D–F, Same plots as A–C for a different neuron recorded in the same experiment. Note the similarity of each neuron's timing relative to LFP and MUA, but consistent differences between neurons. G, Relation between μcc and mean LFP phase at 8–12 Hz. Each dot represents a neuron during synchronized (blue dots) and desynchronized (red dots) periods.
Figure 9.
Figure 9.
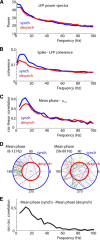
Spike timing with respect to MUA determines relation to LFP specifically at low frequencies. A, LFP power spectra in synchronized and desynchronized states. Note that low-frequency (below ∼20 Hz) power is higher in synchronized states, whereas gamma frequency (50–80 Hz) power is slightly higher in desynchronized states. B, Spike-LFP coherence in both states. Note the prominent low-frequency peak in the synchronized state, which is smaller but still present in the desynchronized state. C, Circular–linear correlation coefficient quantifying the relationship between μcc and preferred LFP phase (Fig. 8G) as a function of frequency band (0–4 Hz, 4–8 Hz, etc.). Note the low-frequency peak, which is larger in the synchronized state. D, Polar plots showing the relationship between preferred phases in synchronized and desynchronized states for LFP filtered in 8–12 Hz band (left) and 56–60 Hz band (right). Each line represents one neuron. The radial fan out of lines visible for the 8–12 Hz band indicates that most neurons have the same preferred phase for synchronized and desynchronized states, which is not the case for higher frequencies (right). E, Circular–circular correlation quantifying the similarity of preferred phase in synchronized and desynchronized states, as a function of frequency band. All plots except D show a mean over all rats.
Figure 10.
Figure 10.
Cortical state, population rate, and information coding. A, Information coding depends on instantaneous population rate during the sustained period, but does not otherwise differ between states. Sustained-period responses were divided into 50 ms overlapping bins, and bins were divided into 10 groups corresponding to different population rates. Within each group, information about tone frequency was estimated for firing rate vectors occurring during synchronized (blue line) and desynchronized (red line) states (see Materials and Methods). Continuous lines show averages across all rats, and dashed lines show the ±SEM. As expected, information content is higher during epochs of high rate, but for a given population rate there was no further effect of cortical state. B, Periods of high instantaneous population rate also exhibit strongest sequential organization. For each of the 10 population rate groups, the stereotypy of sequential ordering among neurons was assessed by the correlation coefficient of μcc values to those measured in spontaneous activity (black dots; data from one representative experiment). To verify that the observed relationship was not just because sequential order can be more reliably evaluated from a larger number of spikes, we equalized the number of spikes in all groups by randomly removing spikes, and sequential order was recalculated (green dots).
Figure 11.
Figure 11.
Model for auditory cortical population responses to sustained tones. In synchronized states (top), population activity consists of discrete packets separated by periods of global silence. Tone onset reliably induces an activity packet, but packets also occur sporadically throughout the sustained and spontaneous periods. Within each packet, neurons fire with a stereotyped sequential pattern. Presentation of a neuron's preferred tone causes it to fire at higher rates during activity packets, but not to fire outside packet periods. In desynchronized states (bottom), population activity does not show long periods of silence, but temporal relationships between neurons are similar to those in the synchronized state. This can be explained by a model in which many packets, individually similar to those seen in the synchronized state, are superimposed to produce a firing pattern that exhibits smaller fluctuations in global activity but retains a fine temporal structure.

Comment in

Similar articles

Cited by

References

    1. Bartho P, Curto C, Luczak A, Marguet SL, Harris KD. Population coding of tone stimuli in auditory cortex: dynamic rate vector analysis. Eur J Neurosci. 2009;30:1767–1778. - PMC - PubMed
    1. Battaglia FP, Benchenane K, Sirota A, Pennartz CM, Wiener SI. The hippocampus: hub of brain network communication for memory. Trends Cogn Sci. 2011;15:310–318. - PubMed
    1. Benucci A, Ringach DL, Carandini M. Coding of stimulus sequences by population responses in visual cortex. Nat Neurosci. 2009;12:1317–1324. - PMC - PubMed
    1. Berens P. CircStat: A MATLAB toolbox for circular statistics. J Stat Softw. 2009;31:1–21.
    1. Breiman L. Random forests. Machine Learn. 2001;45:5–32.

Publication types

LinkOut - more resources