. 2013 Mar 1;190(5):1948-60.
doi: 10.4049/jimmunol.1201718. Epub 2013 Jan 23.

Activated invariant NKT cells control central nervous system autoimmunity in a mechanism that involves myeloid-derived suppressor cells

Affiliations

Activated invariant NKT cells control central nervous system autoimmunity in a mechanism that involves myeloid-derived suppressor cells

Vrajesh V Parekh et al. J Immunol. .

Abstract

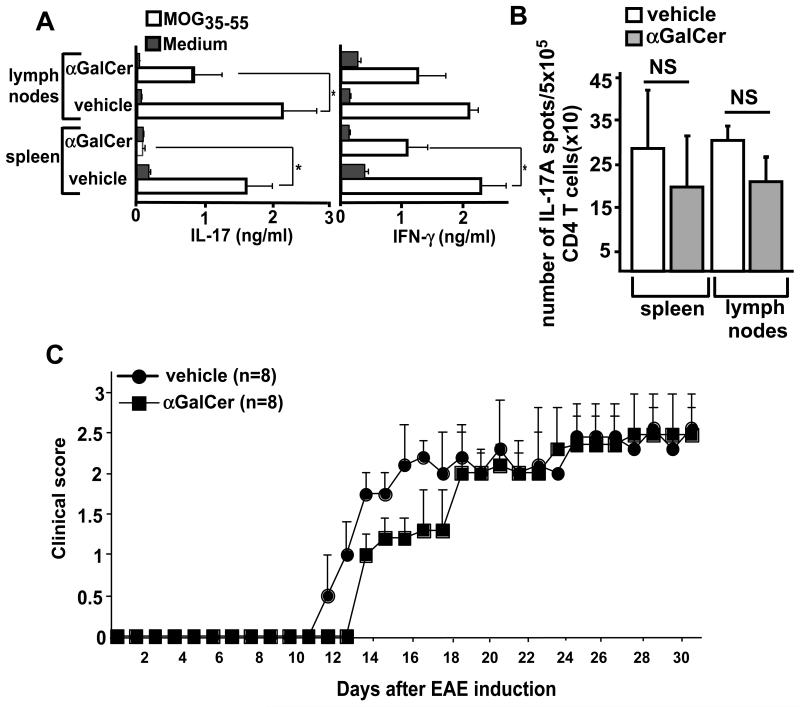
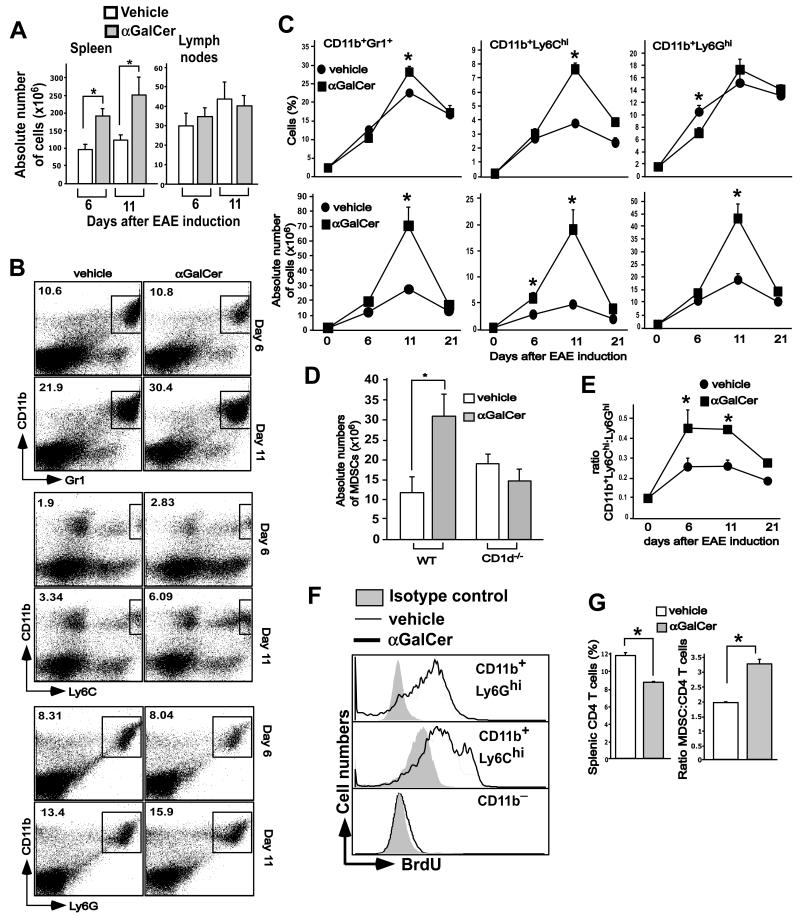
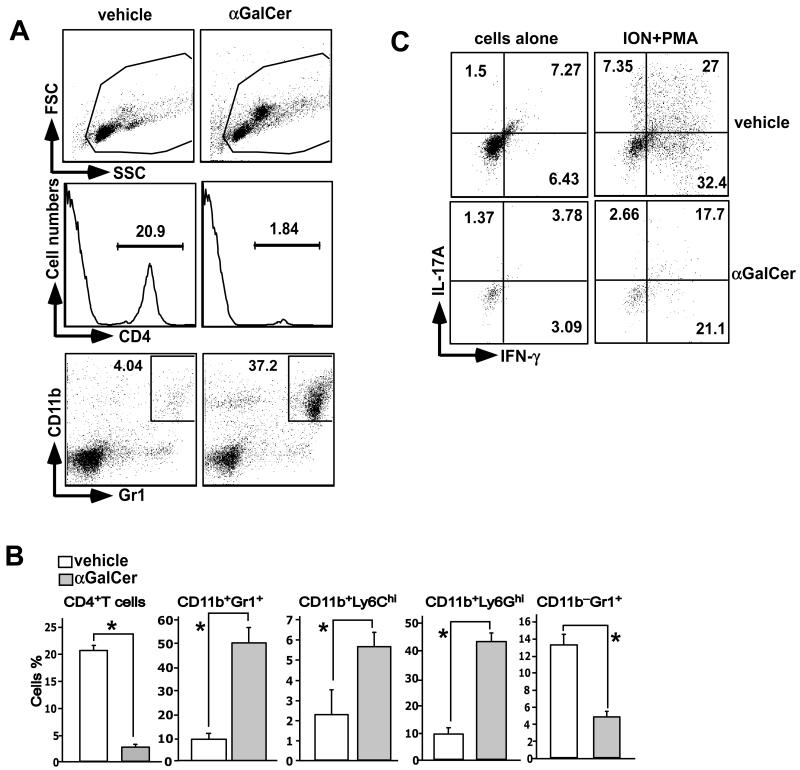
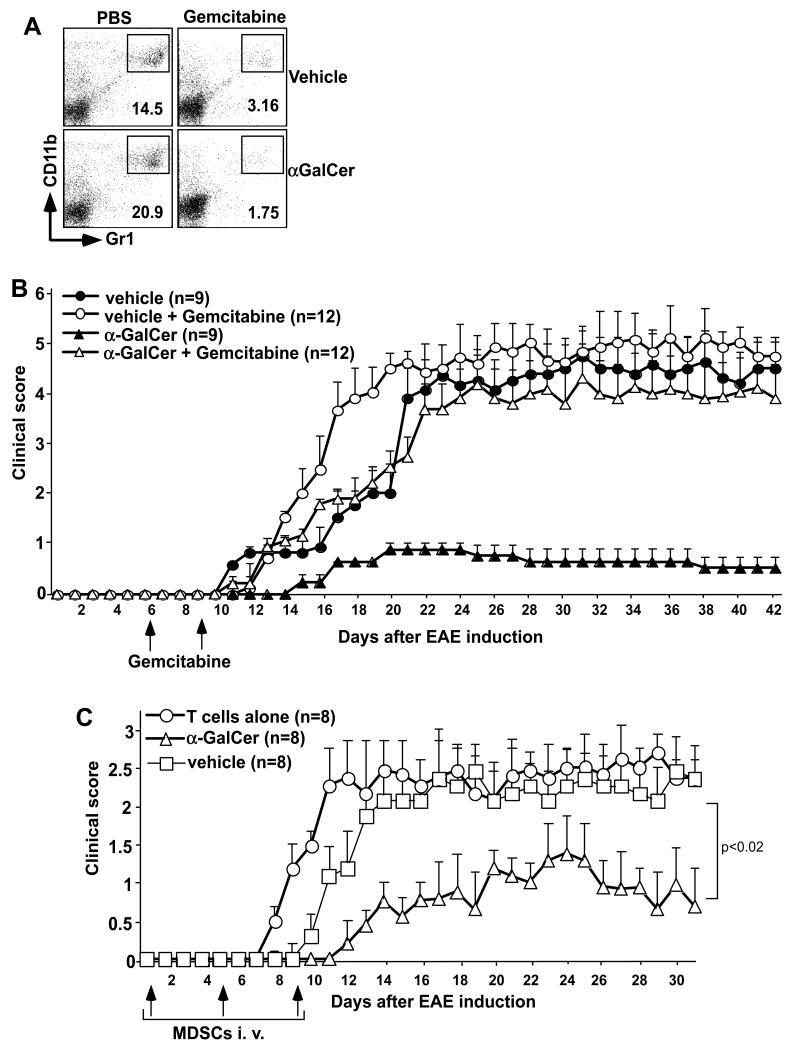
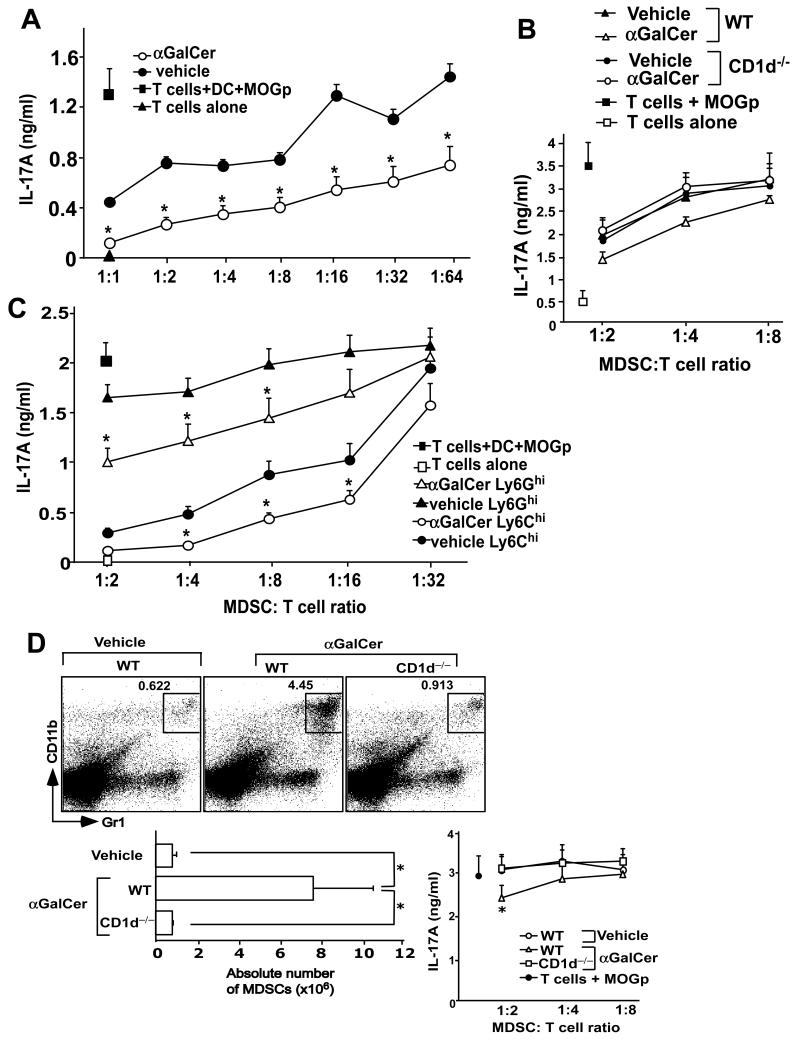
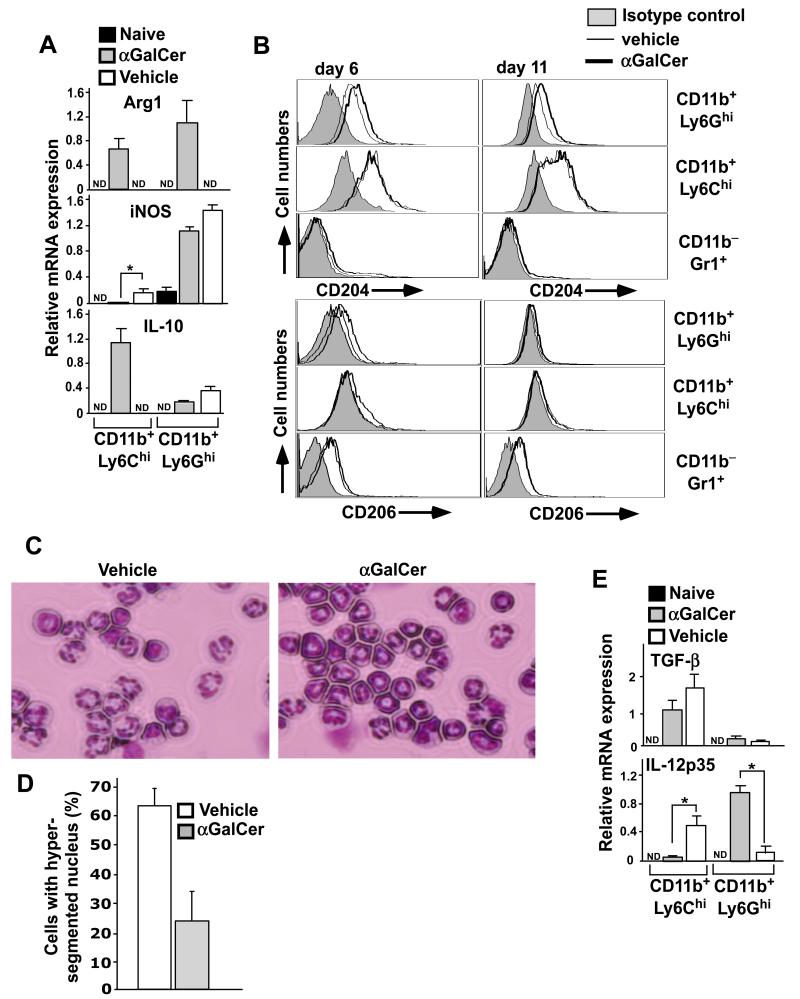
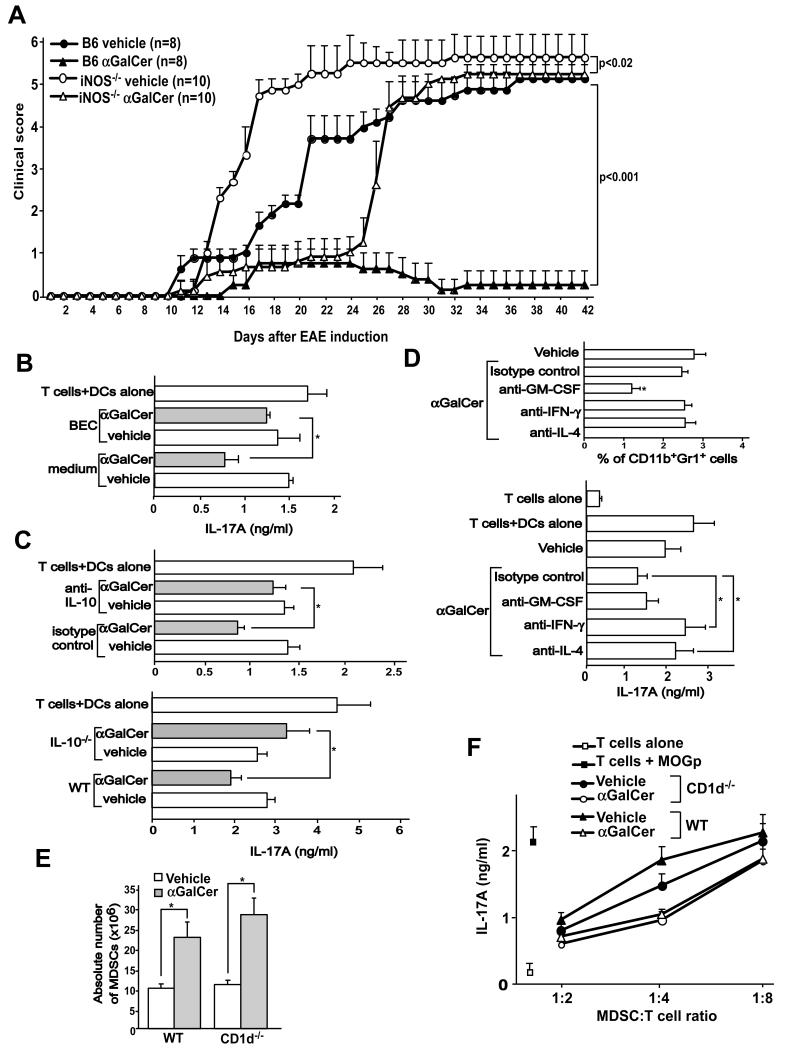
Invariant NKT (iNKT) cells are a subset of T lymphocytes that recognize glycolipid Ags presented by the MHC class I-related protein CD1d. Activation of iNKT cells with glycolipid Ags, such as the marine sponge-derived reagent α-galactosylceramide (α-GalCer), results in the rapid production of a variety of cytokines and activation of many other immune cell types. These immunomodulatory properties of iNKT cells have been exploited for the development of immunotherapies against a variety of autoimmune and inflammatory diseases, but mechanisms by which activated iNKT cells confer disease protection have remained incompletely understood. In this study, we demonstrate that glycolipid-activated iNKT cells cooperate with myeloid-derived suppressor cells (MDSCs) in protecting mice against the development of experimental autoimmune encephalomyelitis (EAE) in mice, an animal model for multiple sclerosis. We show that α-GalCer induced the expansion and immunosuppressive activities of MDSCs in the spleen of mice induced for development of EAE. Disease protection in these animals also correlated with recruitment of MDSCs to the CNS. Depletion of MDSCs abrogated the protective effects of α-GalCer against EAE and, conversely, adoptive transfer of MDSCs from α-GalCer-treated mice ameliorated passive EAE induced in recipient animals. The cytokines GM-CSF, IL-4, and IFN-γ, produced by activated iNKT cells, and inducible NO synthase, arginase-1, and IL-10 produced by MDSCs, contributed to these effects. Our findings have revealed cooperative immunosuppressive interactions between iNKT cells and MDSCs that might be exploited for the development of improved immunotherapies for multiple sclerosis and other autoimmune and inflammatory diseases.


Figures

FIGURE 1
FIGURE 1
Pathogenic T cells in MOGp-challenged and α-GalCer-treated mice are actively suppressed. B6 mice were induced with EAE, treated with vehicle or α-GalCer and sacrificed 11 days later. (A) Splenocytes or draining LN cells were stimulated in vitro with or without MOGp, and the cytokines IL-17A and IFN-γ in the supernatant were measured 3 days later by ELISA. *p<0.05. (B) To determine the frequency of MOGp-specific Th17 cells by ELISPOT assay, CD4+ T cells were purified and stimulated with DCs and MOGp in anti-IL-17A coated ELISPOT plates for 24 hrs. The plates were developed and the spots were counted on an automated immunosplot image analyzer. NS, not significant. (C) Splenocytes derived from vehicle- or α-GalCer-treated mice were depleted of CD11b+ cells and were stimulated with MOGp for 72 hrs in vitro. Live cells (5×10⁶) were adoptively transferred into irradiated B6 mice to induce passive EAE. EAE clinical scores were determined as described in Methods.
FIGURE 2
FIGURE 2
α-GalCer-mediated expansion of MDSCs in EAE-induced mice. B6 mice were induced with EAE and treated with vehicle or α-GalCer. (A) Splenic and lymph node cellularity in vehicle- or α-GalCer-treated mice induced for development of EAE. B6 mice were induced with EAE and treated with vehicle or α-GalCer. At the indicated times the cellularity of spleen and lymph nodes was determined. The data presented are the mean ± SEM of 6 mice per group and representative of at least 3 individual experiments. *p<0.05. (B) At the indicated times after EAE induction, splenocytes were stained with anti-CD11b and -Gr1 antibodies, or with anti-CD11b, -Ly6G and -Ly6C antibodies, as indicated. CD11b+Ly6GhiLy6C cells represent G-MDSCs and CD11b+Ly6GLy6Chi cells represent M-MDSCs. (C) The absolute numbers of CD11b+Gr1+ MDSCs, CD11b+Ly6Ghi G-MDSCs and CD11b+Ly6Chi M-MDSCs were determined based on splenic cellularity. *p<0.05. (D) Absolute numbers of MDSCs in wild-type and of MDSCs in wild-type and mice at day 11 after EAE induction. *p<0.05. (E) The ratio of absolute numbers of CD11b+Ly6Chi M-MDSCs to CD11b+Ly6G+ G-MDSCs was calculated at various time points after EAE induction. *p<0.05. (F) BrdU was injected in mice starting from day 7 after EAE induction, twice a day for two days. The cells were stained with anti-CD11b, -Ly6G and -Ly6C antibodies followed by staining with anti-BrdU antibody or its isotype control antibody. Representative plots of 3 independent experiments are shown. (G) Percent of CD4+ T cells and the ratio of MDSCs to CD4+ T cells are depicted. The results are plotted as the mean ± SEM of 6 mice and are representative of 5 independent experiments. *p<0.05.
FIGURE 3
FIGURE 3
Infiltration of MDSCs and CD4 T cells into the CNS. B6 mice were induced with EAE, treated with vehicle or α-GalCer, sacrificed 21 days later, and cells infiltrating the spinal cord were isolated. (A,B) Cells were stained with anti-CD4 antibodies, anti-CD11b and -Gr1 antibodies, or anti-CD11b anti-Ly6G and -Ly6C antibodies. Representative data are shown in (A). Note the change in the scatter profile of cells isolated from α-GalCer-treated mice (top panels), which is predominantly due to infiltration of MDSCs. A summary of the percentage of cells from 6 individual mice from 3 independent experiments is shown. *p<0.05. (C) Cells were stimulated with ionomycin (ION) plus PMA in the presence of Golgi Plug™ for 5 hrs. The cells were then surfaced-stained with anti-CD4 antibody followed by intracellular staining with anti-IL-17A and -IFN-γ antibodies. A representative of 3 experiments is shown.
FIGURE 4
FIGURE 4
Effects of MDSC depletion or adoptive transfer on EAE. (A,B) EAE was induced in B6 mice and these animals were treated with vehicle or α-GalCer. Mice were then treated at days 6 and 9 after EAE induction with PBS or gemcitabine at 20 mg/kg body weight by i.p. injection. (A) At day 11 after EAE induction, spleen cells were analyzed for the prevalence of MDSCs. Note that >80% depletion was observed. (B) EAE clinical scores were determined as described in Methods. (C) Mice induced with aEAE were treated with vehicle or α-GalCer and sacrificed 11 days after EAE induction. MDSCs were enriched from the spleen using magnetic sorting, pulsed with MOGp at 100 μg/ml for 1 hr and 5×10⁶ cells were adoptively transferred into B6 mice on days 1, 4 and 9 following induction of pEAE with MOGp-specific T cells. EAE clinical scores were determined as described for active EAE. Combined data for two experiments with 4 mice in each group are shown.
FIGURE 5
FIGURE 5
Inhibition of MOGp-specific Th17 cells by MDSCs. CD4+ T cells were isolated at day 11 after EAE induction and were stimulated with DCs and MOGp in the presence of varying numbers of total MDSCs from wild-type mice (A), total MDSCs derived from wild-type or CD1d̄ mice (B), or G-MDSCs or M-MDSCs (C) derived from MOGp-challenged mice treated with vehicle or α-GalCer. IL-17A production in the culture supernatants was measured by ELISA. (D) Naïve B6 mice were injected i.p. with 2 μg α-GalCer at days 0, 4, and 7. At day 11 the percentage (top) and absolute numbers (bottom left) of MDSCs, and the ability of these cells to inhibit MOGp-specific Th17 cells (bottom right) was determined. The results are the mean ± SEM of 3 mice and are a representative of at least 3 experiments. *p<0.05.
FIGURE 6
FIGURE 6
Expression of anti-inflammatory proteins by MDSCs from α-GalCer-treated mice. (A) At day 11 after EAE induction, G- and M-MDSCs were enriched by preparative flow cytometry and RNA was prepared. Relative mRNA levels of Arg1, iNOS and IL-10 were measured by real-time PCR assay. The mean ± SEM of 4 mice is shown. *p<0.05; ND, not detected. (B) At day 6 and 11 after EAE induction, splenocytes were stained with different combinations of anti-CD11b, -Gr1, -Ly6G, -Ly6C, -CD204 and -CD206 antibodies. Representative plots are shown from a total of 6 individual mice from two independent experiments. (C) G-MDSCs enriched from vehicle- or α-GalCer-treated mice were cytospun on slides, stained with HEMA3 staining kit and the nuclear morphology was examined (magnification: 40×). (D) Cells were prepared as in (C) and the number of cells containing hypersegmented nuclei was counted manually and plotted as percent of cells. Nearly 50 cells were counted from randomly chosen fields and a total of at least 300 cells were counted from each mouse. The data presented are the mean ± SEM of 2 mice and representative of 4 mice in each group. (E) Relative mRNA levels of IL-12 p40 and TGF-β were measured by real-time PCR assay as in (A). The mean ± SEM of 4 mice is shown. *p<0.05; ND, not detected.
FIGURE 7
FIGURE 7
Role of iNOS, Arg1 and cytokines in the protective effects of α-GalCer against EAE. (A) B6 and iNOS−/− mice were induced with EAE and treated with vehicle or α-GalCer. The course of EAE disease was monitored and clinical scores were determined. (B) CD4+ T cells were isolated at day 11 after EAE induction in B6 mice and were stimulated with DCs and MOGp in the presence of MDSCs derived from mice treated with vehicle or α-GalCer at a MDSC:T cells ratio of 1:4 in HL-1 medium alone or medium containing BEC (50 μM). IL-17A production was measured in the culture supernatant by ELISA as a readout of Th17 cell activation. (C) CD4+ T cells were isolated at day 11 after EAE induction and were stimulated with DCs and MOGp in the presence of M-MDSCs derived from mice treated with vehicle or α-GalCer at a M-MDSC:T cell ratio of 1:4 in complete medium containing isotype control or anti-IL-10 antibody (10 μg/ml) (top panel). M-MDSCs derived from wild-type or IL-10−/− mice induced for EAE and treated with vehicle or α-GalCer were cultured as above at a M-MDSC:T cell ratio of 1:4 (bottom panel). IL-17A production was measured in the culture supernatant by ELISA as a readout of Th17 cell activation. *p<0.05. (D) B6 mice were treated with CFA and 3 days later splenocytes were activated with α-GalCer for 24 hours in the presence of anti-GM-CSF, -IL-4 or -IFN-γ neutralizing antibodies. The cultures were harvested and the percentage of MDSCs was determined (top panel). MDSCs from these cultures were enriched and were tested for their ability to inhibit MOGp-specific Th17 cells at a MDSC:T cell ratio of 1:2. The data presented are the mean ± SEM of 3 mice and representative of two individual experiments. (E) Mixed bone marrow chimeras were generated using a 1:1 mixture of bone marrow from wild-type (CD45.1) and CD1d−/− (CD45.2) bone marrow injected into B6 mice. After 6-8 weeks, mice were induced with EAE and treated with vehicle or α-GalCer. Wild-type and CD1d−/− hematopoietic cells were distinguished using the congenic markers and the absolute numbers of MDSCs at day 11 after EAE induction were determined. (F) Following induction of EAE and treatment with α-GalCer, wild-type and CD1d−/− MDSCs were enriched from the chimeric animals and their ability to suppress MOGp-specific Th17 cells was determined. The data presented are the mean ± SEM of 4 mice and representative of two individual experiments.

References

    1. Bendelac A, Savage PB, Teyton L. The biology of NKT cells. Annu Rev Immunol. 2007;25:297–336. - PubMed
    1. Taniguchi M, Harada M, Kojo S, Nakayama T, Wakao H. The regulatory role of Valpha14 NKT cells in innate and acquired immune response. Annu Rev Immunol. 2003;21:483–513. - PubMed
    1. Kronenberg M. Toward an understanding of NKT cell biology: progress and paradoxes. Annu Rev Immunol. 2005;23:877–900. - PubMed
    1. Brigl M, Brenner MB. CD1: antigen presentation and T cell function. Annu Rev Immunol. 2004;22:817–890. - PubMed
    1. Parekh VV, Lalani S, Van Kaer L. The in vivo response of invariant natural killer T cells to glycolipid antigens. Int Rev Immunol. 2007;26:31–48. - PubMed

Publication types

MeSH terms