. 2013 Mar 1;190(5):2415-23.
doi: 10.4049/jimmunol.1202535. Epub 2013 Jan 23.

Tumor-derived IL-35 promotes tumor growth by enhancing myeloid cell accumulation and angiogenesis

Affiliations

Tumor-derived IL-35 promotes tumor growth by enhancing myeloid cell accumulation and angiogenesis

Zhihui Wang et al. J Immunol. .

Abstract

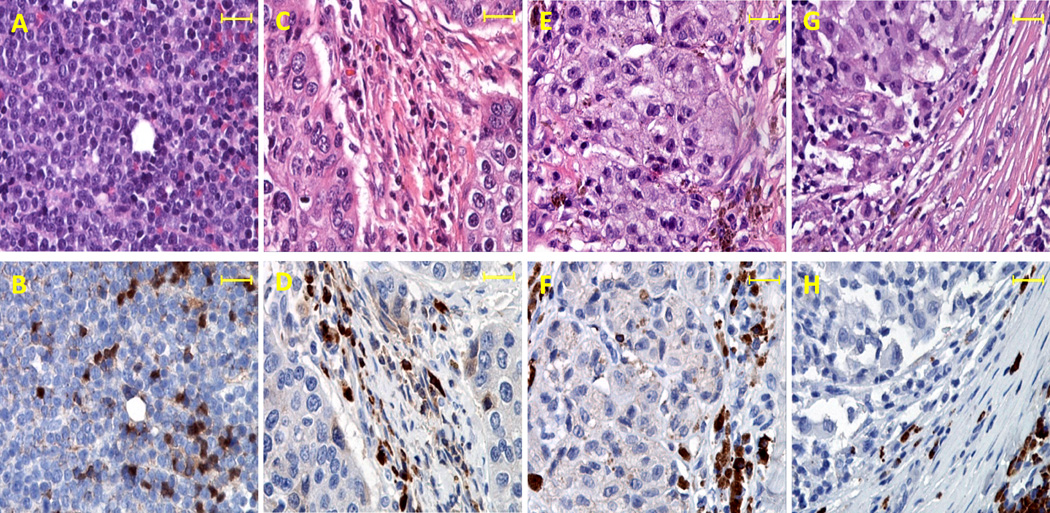
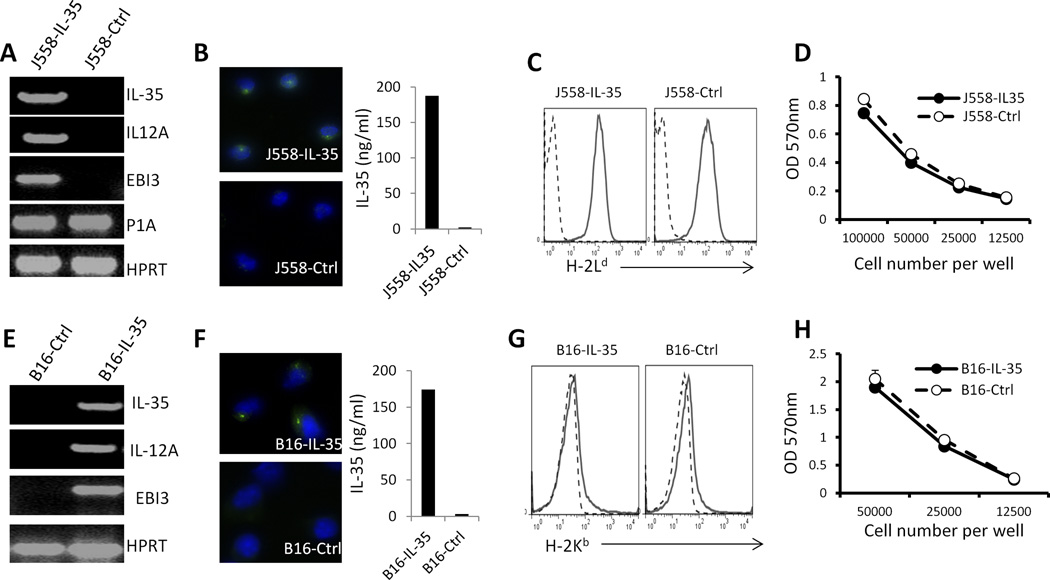
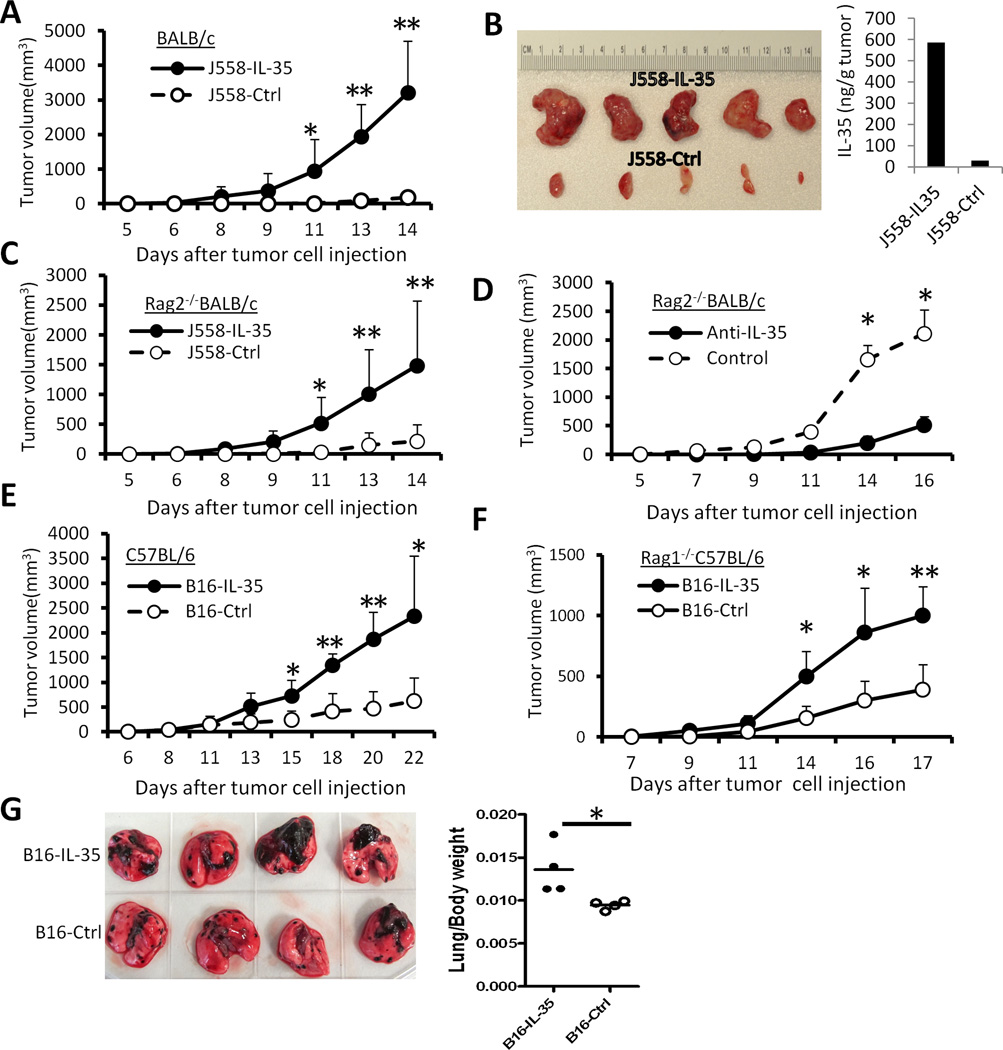
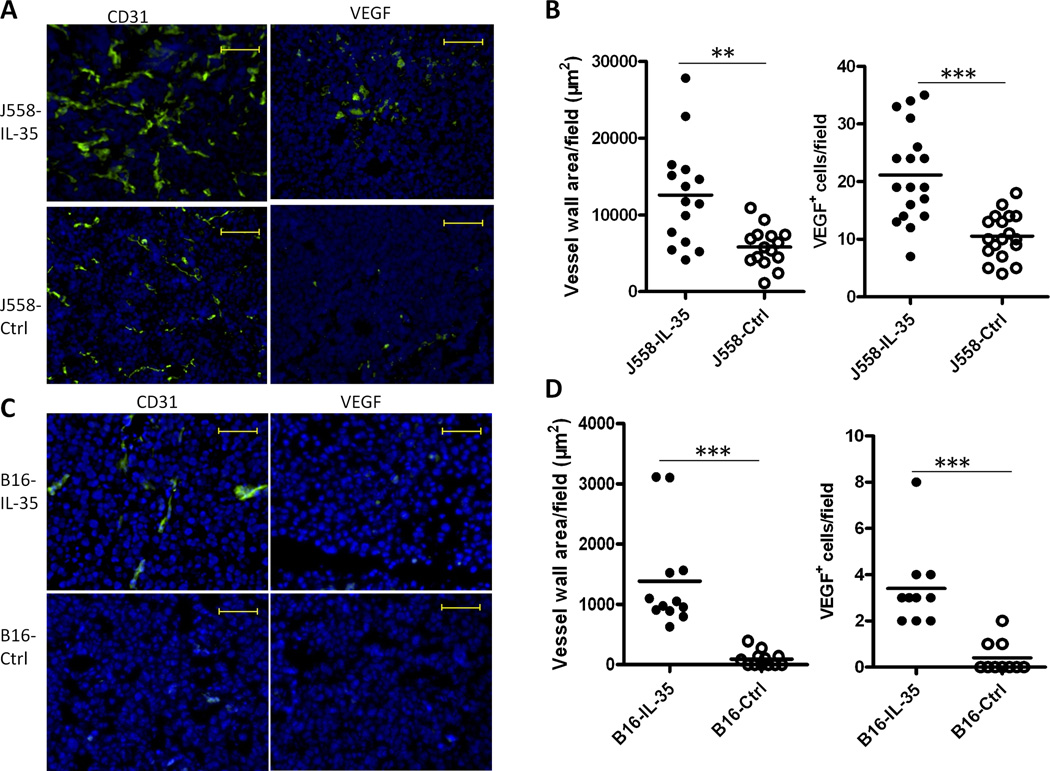
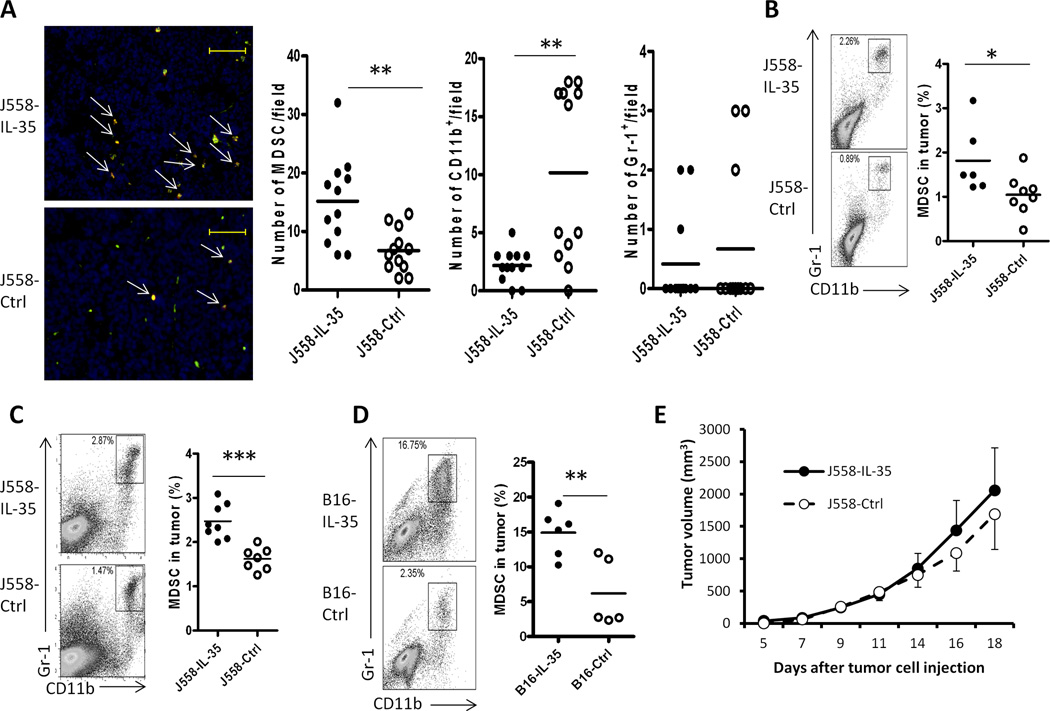
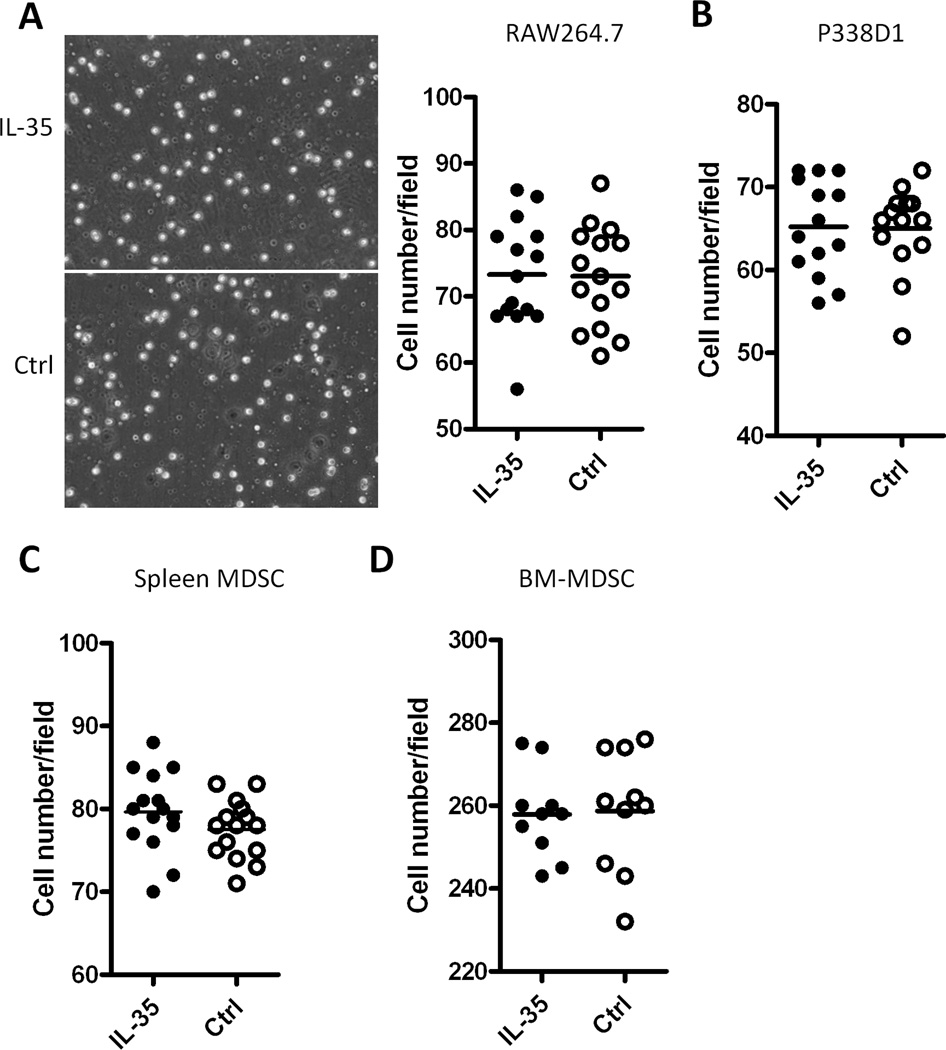
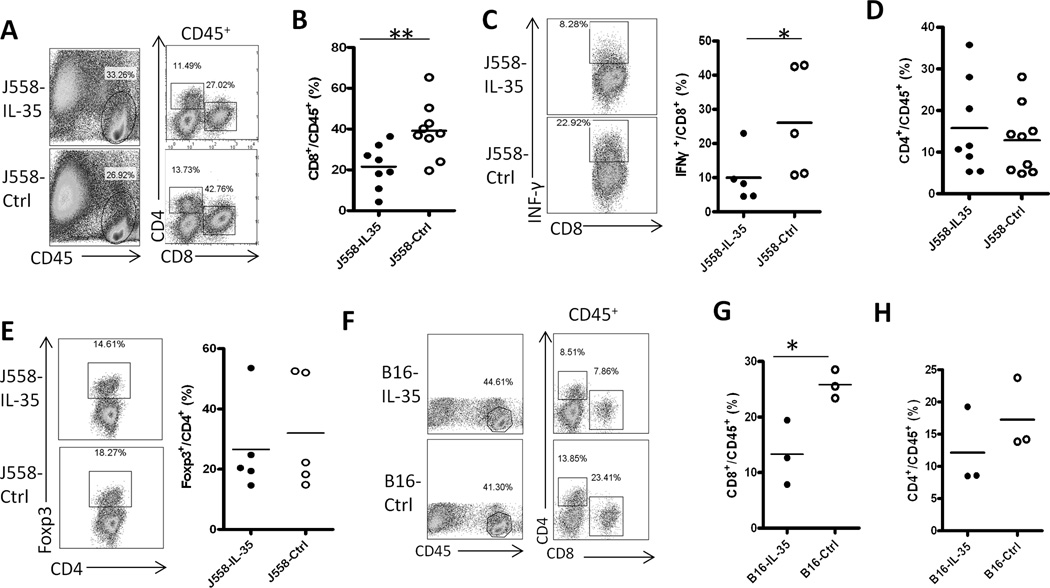
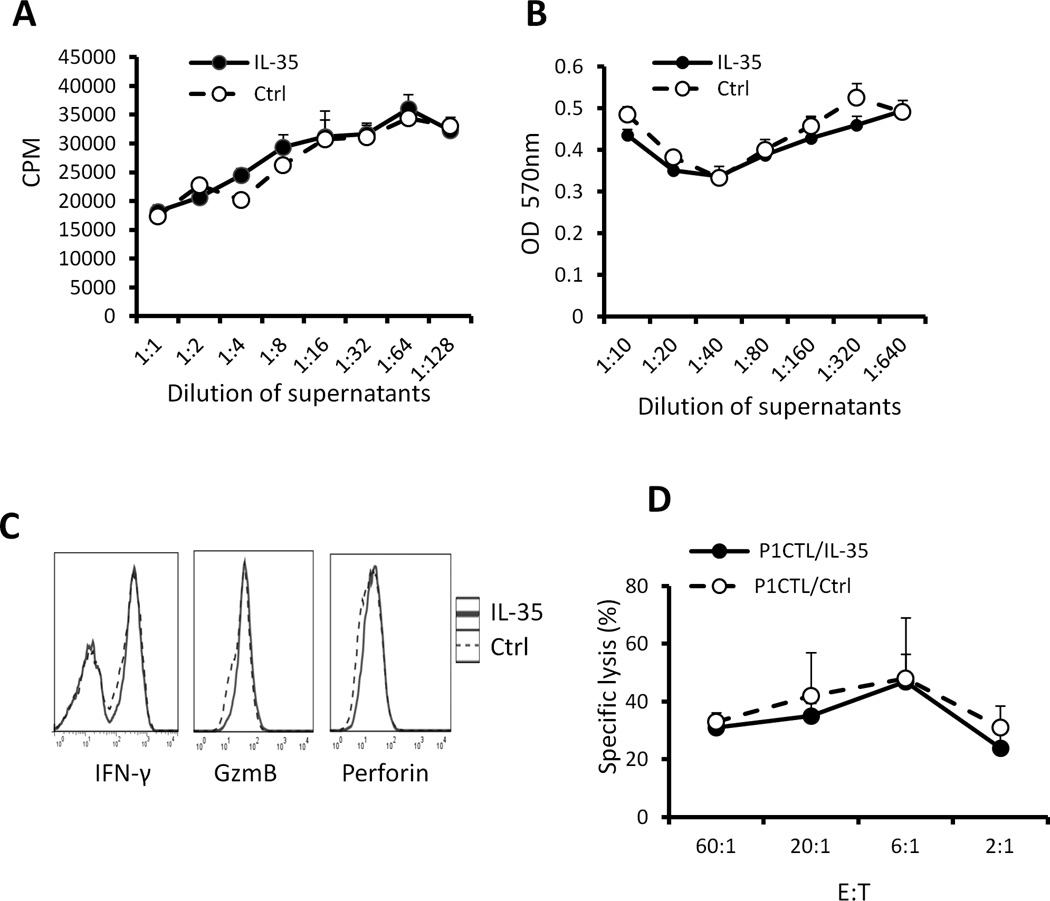
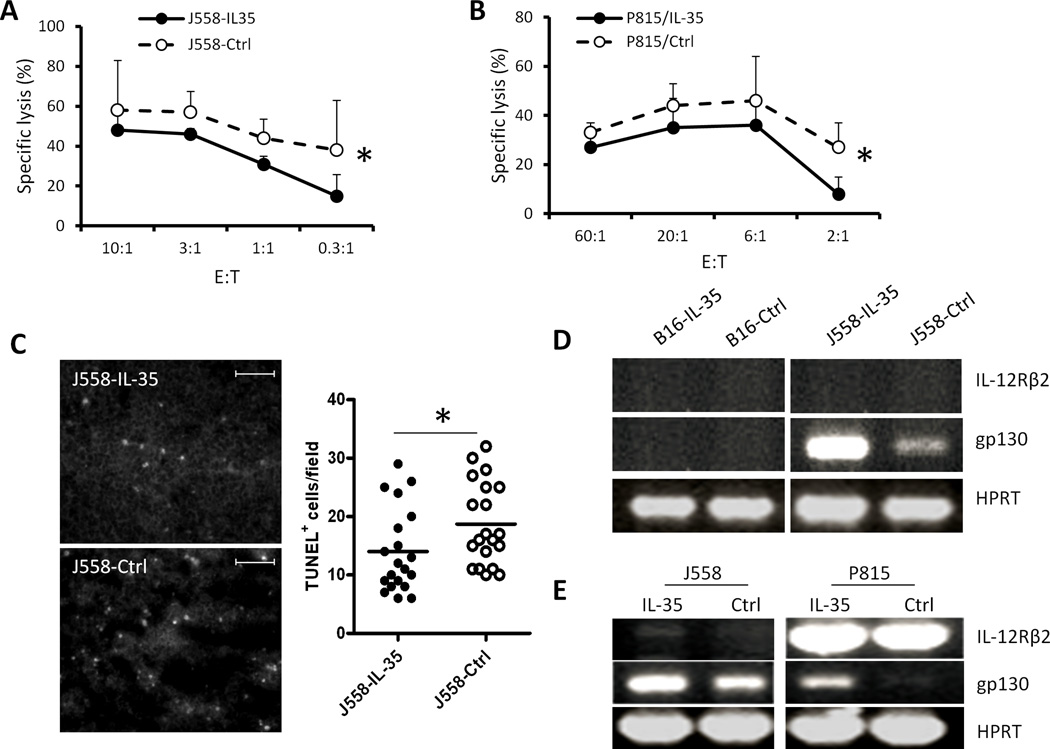
IL-35 is a member of the IL-12 family of cytokines that is comprised of an IL-12 p35 subunit and an IL-12 p40-related protein subunit, EBV-induced gene 3 (EBI3). IL-35 functions through IL-35R and has a potent immune-suppressive activity. Although IL-35 was demonstrated to be produced by regulatory T cells, gene-expression analysis revealed that it is likely to have a wider distribution, including expression in cancer cells. In this study, we demonstrated that IL-35 is produced in human cancer tissues, such as large B cell lymphoma, nasopharyngeal carcinoma, and melanoma. To determine the roles of tumor-derived IL-35 in tumorigenesis and tumor immunity, we generated IL-35-producing plasmacytoma J558 and B16 melanoma cells and observed that the expression of IL-35 in cancer cells does not affect their growth and survival in vitro, but it stimulates tumorigenesis in both immune-competent and Rag1/2-deficient mice. Tumor-derived IL-35 increases CD11b(+)Gr1(+) myeloid cell accumulation in the tumor microenvironment and, thereby, promotes tumor angiogenesis. In immune-competent mice, spontaneous CTL responses to tumors are diminished. IL-35 does not directly inhibit tumor Ag-specific CD8(+) T cell activation, differentiation, and effector functions. However, IL-35-treated cancer cells had increased expression of gp130 and reduced sensitivity to CTL destruction. Thus, our study indicates novel functions for IL-35 in promoting tumor growth via the enhancement of myeloid cell accumulation, tumor angiogenesis, and suppression of tumor immunity.


Figures

Fig.1
Fig.1. Expression of IL-35 in human cancer tissues
H&E staining and IHC were performed on paraffin-embedded serial tissue sections of human large B cell lymphoma (A–B), nasopharyngeal carcinoma (C–D), skin melanoma (E–F) and lymph node metastatic melanoma (G–H). The anti-human IL-35 mAb 15K8D10 (Imgenex, CA) was used to stain human cancer tissues. Images shown in the upper panel (A, C, E and G) are H&E staining, and images shown in the lower panel (B, D, F and H) are IL-35 specific staining. Scale bars, 100µm.
Fig.2
Fig.2. Generation of IL-35 producing J558 and B16.F10 cells
Mouse plasmacytoma J558 cells or B16F10 melanoma cells were co-transfected with an expression vector pORF9-IL-35 (Invivogen) and a selection vector (pCDNA-neo) or the control expression vector pORF9 (Invivogen) and pCDNA-neo. Stable cell lines that were resistant to G418 were generated. RT-PCR was used for detecting the expression of transcripts for recombinant IL-35, IL-12A, EBI3 and tumor antigen P1A in J558 cells (A) and IL-35, IL-12A and EBI3 transcripts in B16F10 cells (E). Immunofluorescence staining and ELISA revealed that IL-35 protein was produced by the generated J558 (B) and B16.F10 (F) cells. Flow cytometry was used for the analysis of MHC class I expression on the generated J558 cells (C) and B16 cells (G). MTT proliferation assay (MTT kit, ATCC) was used to measure growth and proliferation of J558 cells (D) and B16 cells (H). Bars indicate SD of triplicates.
Fig.3
Fig.3. Expression of IL-35 in the tumor microenvironment enhances tumorigenesis
5 × 10⁶ J558-IL-35 or J558-Ctrl cells were injected into each BALB/c (A) or Rag2−/−BALB/c mouse (C) s.c. The tumor growth was observed over time, and at the end of experiments, tumors were removed from sacrificed mice and photographed. Shown in photo (B) are J558-IL-35 and J558-Ctrl tumors removed from BALB/c mice. ELISA was used to quantify IL-35 concentration in lysates of representative tumors (B). Each Rag2−/−BALB/c mouse was inoculated with 5 × 10⁶ J558-IL-35 cells s.c. in the presence of anti-IL-35 (V1.4C4.22, Shenandoah Biotechnology) or an isotype-matched control mAb (IgG2b, BioXcell) at a concentration of 50 µg/ml. Mice were observed for tumor growth over time. Bars indicate SD of 3 mice in each group and data shown represent two experiments with similar results. 1 × 10⁵ B16-IL-35 or B16-Ctrl cells were injected into each C57BL/6 (E) or Rag1−/−C57BL/6 mouse (F) s.c. The tumor growth was observed over time. Bars in A, C, D, E and F indicate SD of 5 mice in each group. Data shown represents three to five experiments with similar results. (G) 1 × 10⁵ B16-IL-35 or B16-Ctrl cells were injected into each C57BL/6 i.v. Eighteen days after tumor cell injection, lungs from the recipient mice were removed, photographed (left) and weighed, and lung/body weight ratios were calculated and plotted in the right panel. *P<0.05; **P<0.01 by student’s t test.
Fig.4
Fig.4. IL-35 production in the tumor microenvironment enhances angiogenesis
J558 tumors (A–B) from Rag2−/− mice and B16 tumors from C57BL6 mice (C–D) were analyzed for the expression of CD31 and VEGF by immunofluorescent staining and microscopy. Scale bars, 200µm. Mean vessel wall area and numbers of VEGF-positive cells for each tumor were analyzed and quantified using the ImageJ software (NIH). Three random fields from each slide/tumor were analyzed, and each dot represents values from one microscope field. *P<.05; **P=0.001, ***P<.0001 by student’s t test.
Fig.5
Fig.5. Increased numbers of CD11b+Gr1+ myeloid cells in the tumor microenvironment of IL-35-positive tumors
J558-IL-35 and J558-Ctrl tumors from Rag2−/− mice were analyzed for the infiltration of myeloid cells by immunofluorescence staining and microscopy (A). Frozen tissue sections were co-labeled for CD11b (Alexa488) and Gr1 (Texas Red) and images were analyzed and quantified using the ImageJ software. Scale bars, 200µm. Three random fields from each slide/tumor were analyzed, and each dot represents values from one microscope field. **P<.001 by student’s t test. Flow cytometry was also used for the analysis of myeloid cells in IL-35-positive and IL-35-negative tumors (B–D). Single cell suspensions were prepared from tumors grown in Rag2−/− (B), BALB/c (C) and C57BL6 (D) mice and stained for CD11b and Gr-1 followed by flow cytometry analysis. Each circle represents data from a single tumor. *P<.05; **P<.01 by student’s t test. (E) 5 × 10⁶ J558-IL-35 or J558-Ctrl cells were injected into each BALB/c mouse s.c. followed by treatment with 250 µg/mouse of anti-Gr1 mAb (RB6-8C5, BioXcell) i.p. on day 0, 5 and 10. Mice were observed for tumor growth over time. Five mice per group were used for this experiment and data shown represent two experiments with similar results.
Fig.6
Fig.6. IL-35 does not increase migratory activity of myeloid cells
Migration assay using a trans-well system with or without IL-35 was performed to test the migration capacity of Raw264.7 cells (Fig.6A), P338D1 cells (Fig.6B), spleen MDSC (Fig.6C) and bone marrow Gr1+ cells (Fig.6D). Cells that migrated to the bottom side of the trans-well membrane were stained with Dapi, and random fields from each well were photographed under fluorescence microscope. Numbers of cells in each field were quantified using the ImageJ software (NIH). Each dot represents values from one microscopic field and data shown represents three experiments with similar results.
Fig.7
Fig.7. Expression of IL-35 contributes to an immune suppressive microenvironment
J558 cells or B16 cells with or without IL-35 expression were injected into each BALB/c or C57BL6 mouse s.c., when tumors were fully established (about 1 cm in length), mice were sacrificed and T cell responses in tumors were evaluated by flow cytometry. A–E: T cell responses in IL-35 positive and negative J558 tumors from BALB/c mice. F–H: T cell responses in IL-35 positive and negative B16 tumors from C57BL6 mice. Each circle represents data from a single mouse/tumor. *P<.05; **P<.01 by student’s t test.
Fig.8
Fig.8. IL-35 does not directly affect differentiation of tumor antigen specific CTL
Splenocytes from P1CTL transgenic mice were activated with P1A peptide (0.2 µg/ml) in the presence or absence of IL-35. 3H-Tritium incorporation assay (A) and MTT assay (B) was used to determine cell proliferation and survival. Intracellular staining and flow cytometry were used to determine IFN-γ and Granzyme B expression in activated P1CTL cells (C). 51Cr-release assay was used to determine cytotoxicity of activated P1CTL cells to P815 target cells (D).*P<.05, paired student’s t test. Data shown represent at least three experiments with similar results.
Fig.9
Fig.9. IL-35 induces tumor cell resistance to CTL destruction
P1CTL cells were activated with P1A peptide (0.2µg/ml) for 5 days. 51Cr-release assay was used to determine cytotoxicity of activated P1CTL cells to J558-IL-35/J558-Ctrl cells (A) and P815 cells treated with or without IL-35 (B). Data shown represent three experiments with similar results. Frozen tissue sections from J558-IL-35 or J558-Ctrl tumors grown in BALB/c mice were labeled for TUNEL and images were photographed under a fluorescent microscope and quantified using the ImageJ software (C). Scale bars, 200µm. Three random fields from each slide/tumor were analyzed, and each dot represents values from one microscope field. *P<.05 by student’s t test. RT-PCR was used to detect IL-35 receptor subunits in B16-IL-35/B16-Ctrl and J558-IL-35/J558-Ctrl cells (D) or in J558 and P815 cells treated with or without IL-35 (E). Data shown in D and E represent three experiments with similar results.

Similar articles

Cited by

References

    1. Devergne O, Birkenbach M, Kieff E. Epstein-Barr virus-induced gene 3 and the p35 subunit of interleukin 12 form a novel heterodimeric hematopoietin. Proc Natl Acad Sci U S A. 1997;94:12041–12046. - PMC - PubMed
    1. Niedbala W, Wei XQ, Cai B, Hueber AJ, Leung BP, McInnes IB, Liew FY. IL-35 is a novel cytokine with therapeutic effects against collagen-induced arthritis through the expansion of regulatory T cells and suppression of Th17 cells. Eur J Immunol. 2007;37:3021–3029. - PubMed
    1. Collison LW, Workman CJ, Kuo TT, Boyd K, Wang Y, Vignali KM, Cross R, Sehy D, Blumberg RS, Vignali DA. The inhibitory cytokine IL-35 contributes to regulatory T-cell function. Nature. 2007;450:566–569. - PubMed
    1. Collison LW, Delgoffe GM, Guy CS, Vignali KM, Chaturvedi V, Fairweather D, Satoskar AR, Garcia KC, Hunter CA, Drake CG, Murray PJ, Vignali DA. The composition and signaling of the IL-35 receptor are unconventional. Nat Immunol. 2012;13:290–299. - PMC - PubMed
    1. Bardel E, Larousserie F, Charlot-Rabiega P, Coulomb-L'Hermine A, Devergne O. Human CD4+ CD25+ Foxp3+ regulatory T cells do not constitutively express IL-35. J Immunol. 2008;181:6898–6905. - PubMed

Publication types

MeSH terms