. 2013 Apr;54(4):936-52.
doi: 10.1194/jlr.M031450. Epub 2013 Jan 22.

Regulation of integrin αV subunit expression by sulfatide in hepatocellular carcinoma cells

Affiliations

Regulation of integrin αV subunit expression by sulfatide in hepatocellular carcinoma cells

Wei Wu et al. J Lipid Res. 2013 Apr.

Abstract

Integrin is important in migration and metastasis of tumor cells. Changes of integrin expression and distribution will cause an alteration of cellular adhesion and migration behaviors. In this study, we investigated sulfatide regulation of the integrin αV subunit expression in hepatoma cells and observed that either exogenous or endogenous sulfatide elicited a robust upregulation of integrin αV subunit mRNA and protein expression in hepatoma cells. This regulatory effect occurred with a corresponding phosphorylation (T739) of the transcription factor Sp1. Based on the electrophoretic mobility shift assay, sulfatide enhanced the integrin αV promoter activity and strengthened the Sp1 complex super-shift. The results of chromatin immunoprecipitation analysis also indicated that sulfatide enhanced Sp1 binding to the integrin αV promoter in vivo. Silence of Sp1 diminished the stimulation of integrin αV expression by sulfatide. In the early stage of sulfatide stimulation, phosphorylation of Erk as well as c-Src was noted, and inhibition of Erk activation with either U0126 or PD98059 significantly suppressed Sp1 phosphorylation and integrin αV expression. We demonstrated that sulfatide regulated integrin αV expression and cell adhesion, which was associated with Erk activation.


Figures
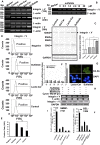
Fig. 1.
Fig. 1.
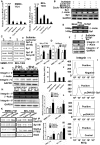
Expression of integrin αV subunit was regulated by exogenous sulfatide. (A) SMMC-7721 cells were treated with 2 μM sulfatide, Gal-Cer, and Lacto-Cer for 12, 24, and 36 h. The cells were then used for analysis of integrin αV mRNA by RT-PCR. (B) Integrin αV mRNA was detected in SMMC-7721 cells treated with the indicated concentrations of sulfatide for 24 h. (C) SMMC-7721 cells were treated with 2 μM sulfatide, Gal-Cer, and Lacto-Cer for 24 h. The cells were lysed and analyzed by immunoblotting using an antibody against the integrin αV subunit (left panel). The densitometric analysis of the blotting was summarized (right panel). (D) Flow cytometry analysis of the cell surface integrin αV expression. Mouse immunoglobulin was used for a negative control as the unrelated primary antibody. (E) The positive rate of the surface integrin αV staining by flow cytometry analysis. (F) Integrin β3, β5, β6, β8, α5, and αV subunit mRNA was analyzed by real-time PCR after 24 h treatment with sulfatide. (G) Sulfatide was stained with O4 antibody after SMMC-7721 cells were treated with sulfatide and Lacto-Cer for 24 h, fixed, washed, and permeabilized. (H) SMMC-7721 cells were treated with 2 μM sulfatide, Lacto-Cer, ManN-pro, and cyclo-ManN-pro for 24 h, respectively. The expression of the integrin αV subunit mRNA and protein were analyzed by both RT-PCR and Western blotting. (I and J) In SMMC-7721 (I) and BEL-7404 (J) cells as treated in (H); the expression of the integrin αV subunit mRNA was analyzed by real-time PCR. All figures were the representative study and at least two experiments yielded similar results. *P < 0.05, **P < 0.01.
Fig. 2.
Fig. 2.
Regulation of the integrin αV subunit gene expression by endogenous sulfatide. (A and B) In CST transfectants CST-1, CST-8, and Mocks, sulfatide was analyzed by a cell ELISA assay (A) and immunofluorescence detection with O4 antibody under a confocal microscope. The cells were not permeabilized (B). (C) CST knockdown was achieved in the CST RNAi transfectants Chp2 and Chp5 and confirmed by RT-PCR. Scr, scrambled. (D) Expression of the integrin αV in CST-transfected SMMC-7721 cells (CST-1 and CST-8) was analyzed by RT-PCR and Western blotting. Mock3 and Mock4 were transfectants of the control vector. (E) The expression of integrin αV in si-CST SMMC-7721 cells by CST RNAi (Chp2 and Chp5) was analyzed by RT-PCR and Western blotting. Scr1 and Scr2 were transfected with the control vector. All figures were the representative study and at least three additional independent experiments were repeated. *P < 0.05.
Fig. 3.
Fig. 3.
Sulfatide enhanced cell adhesion. SMMC-7721 cells were treated with 2 μM sulfatide, Lacto-Cer, ManN-pro, or cyclo-ManN-pro for 24 h. Then the cells were used for adhesion assay. (A) The adhesion of the treated cells to TNF-α induced HUVECs. The monolayer HUVECs were stimulated with 10 ng/ml TNF-α for 4 h prior to the adhesion assay. After incubation and washing, the attached cells were counted under a phase contrast microscope in five random fields in each well, and the cell number was averaged among the test groups and compared with the affinity of the cells to HUVECs. (B–E) The treated SMMC-7721 cells were examined for their adhesive capability to vitronectin (B), collagen type I (C), fibrinogen (D), and fironectin (E). For the inhibition, the cells were preincubated with 30 mg/ml GRGESP, GRGDSP, 60 μg/ml antibody against integrin αV, and 1 mg/ml heparin, respectively, for 2 h at 4°C. The numbers of cells adhering were represented by A570, and the adhesive rate was calculated. Shown are the means ± SD from five independent experiments with equivalent results. Bars indicate the SD. *P < 0.05, **P < 0.01.
Fig. 4.
Fig. 4.
Observation of Sp1 in the sulfatide-induced expression of integrin αV. (A) The expression level of Sp1 was analyzed with real-time PCR in both SMMC-7721 and BEL-7404 cells with various treatments. (B) After treatment for 24 h, the expression of Sp1 mRNA and protein in the cells was analyzed by RT-PCR and Western blotting. (C) After SMMC-7721 cells were treated with 2 μM sulfatide and Lacto-Cer for 24 h, Sp1 protein expression and phosphorylation were analyzed by immunoblotting. Ser-P, phospho-serine antibody; Sp1-p, antibody against phospho-Sp1 on threonine 739. (D) Densitometry analysis of Sp1 phosphorylation is summarized (Sp1-p, left; Ser-p, right). (E) Sp1 mRNA analysis by RT-PCR. The cells were transfected with Sp1 RNAi plasmid and negative siRNA plasmid, and the Sp1 mRNA was analyzed by RT-PCR. Neg siRNA, negative control siRNA. (F) Influence of Sp1 silence by RNAi (si-Sp1) on the exogenous sulfatide-induced integrin αV expression in SMMC-7721 cells. Scr was the transfection with the control vector containing a scramble sequence. (G) Influence of Sp1 silence by si-Sp1 transfection on the endogenous sulfatide-induced αV expression in CST-1 and CST-8 cells. (H) Sp1 overexpression influence on sulfatide regulation in Si-CST-transfected cells (Chp2 and Chp5). Sp1 was overexpressed by Sp1 transfection (Sp1), which enhanced the endogenous sulfatide-induced αV expression. (I) Flow cytometry analysis of the cell surface integrin αV expression in cells transfected with Sp1 and a vehicle and in cells without transfection (control). (J) The positive rates of the cell surface integrin αV staining were averaged from the experiments of flow cytometry. (K) Stat3 protein was observed in the complex immunoprecipitated by Sp1 antibody (upper panel). Phosphorylation of Stat3 on tyrosine 705 was measured by Western blotting (bottom panel). (L and M) Graphs summarize the densitometry analysis of Stat3/Sp1 (L) and Stat3-p Y705/Stat3 (M). All figures are from a representative study and at least three additional experiments yielded similar results. *P < 0.05, **P < 0.01. IP, immunoprecipitation; IB, immunoblotting.
Fig. 5.
Fig. 5.
Nucleotide sequence of the human integrin αV promoter. The major transcriptional start site as indicated is at position +1. The Sp1 transcriptional factor binding sites are boxed, and the promoter fragment primers are shaded.
Fig. 6.
Fig. 6.
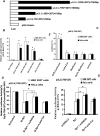
Characterization of the human integrin αV promoter. (A) The promoter fragments were designed according to the Sp1 binding sites in the integrin αV promoter. (B) 5′ deletion analysis of the integrin αV promoter was performed in HEK293T and HeLa cells. The activity of luciferase was statistically analyzed between the construct and the vector pGL3-basic. (C) The luciferase activity was assayed in HEK293T and HeLa cells transfected with the human integrin αV promoter plasmids pGL3(−795/+207) or treated with 2 μM sulfatide for 24 h. The comparison was made between sulfatide and Lac-Cer groups. (D) HEK293T and HeLa cells were cotransfected with the human integrin αV promoter plasmids pGL3(−795/+207) and si-Sp1(pSilence-Sp1) or with a control vector. After transfection for 12 h, HEK293T and HeLa cells were treated with sulfatide and Lacto-Cer for an additional 12 h. The luciferase activities were assayed and expressed as the percentage of the test groups over the control siRNA as the mean ± SD of three separate experiments. (E) HEK293T and HeLa cells were cotransfected with the human integrin αV promoter plasmids pGL3(−795/+207) and the Sp1 expression plasmids pcDNA3.0-Sp1 or with pcDNA3.0. After transfection, HEK293T and HeLa cells were treated with sulfatide and Lacto-Cer for an additional 12 h. The luciferase activities were assayed and expressed as the mean ± SD of three separate experiments. *P < 0.05.
Fig. 7.
Fig. 7.
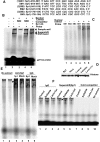
EMSA analysis of the integrin αV subunit gene promoter. (A) Three EMSA probes of the Sp1 transcriptional factor binding sites. SB, Sp1 binding site; SM, mutated Sp1 binding site. (B) EMSA was performed for the (−541/−519) binding site using the nuclear extract from SMMC-7721 cells without treatment. SB2, Sp1 binding site 2; SM2, mutated Sp1 binding site 2. (C) EMSA for the (−619/−597), (−541/−519), and (−176/−154) binding sites using the nuclear extract from SMMC-7721 cells. (D) Immunoblotting with histone 4 as the loading control was performed to adjust the amount of nuclear extracts from the various groups. (E) EMSA for the (−541/−519) binding site. The nuclear extract was from SMMC-7721 cells transfected with pcDNA3.0 and pcDNA3.0-Sp1. The group without adding nuclear extract was the negative control for the complex, and α-IgG was the negative control for Sp1 antibody. (F) EMSA for the (−541/−519) binding site. The nuclear extract was from SMMC-7721 cells with various treatments including sulfatide, Lacto-Cer, and the vehicle. The group without adding nuclear extract was the negative control of the complex, and α-IgG was the negative control for the super-shift.
Fig. 8.
Fig. 8.
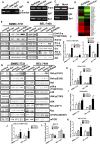
Sulfatide enhancing Sp1 binding to the promoter of integrin αV. (A) Immunoprecipitation of the DNA and Sp1 complexes was performed using an antibody that was specific for Sp1 in ChIP assay. The DNA used as the template for PCR amplification of the integrin αV promoter fragment was from SMMC-7721 cells that were immunoprecipitated by anti-RNA-Polymerase II, control IgG, or Sp1 antibody. Integrin αV promoter was observed in the complex immunoprecipitated by Sp1 antibody, but not in the control IgG. α-RNA-Pol II, anti-RNA-Polymerase II. (B) The DNA from SMMC-7721 cells treated for 24 h with the vehicle, sulfatide, or Lacto-Cer was used as the template in the ChIP assay. The integrin αV promoter was enhanced in the group of sulfatide, but not in Lac-Cer group. (C) The DNA was immunoprecipitated by Sp1 antibody from SMMC-7721 cells transfected with pcDNA3.0 and pcDNA3.0-Sp1, and it was examined by PCR for amplification of the integrin αV promoter. (D) Cluster analysis of the differential gene expression profile in sulfatide and Lacto-Cer treated SMMC-7721 cells. (E) Phosphorylation of the Akt (S473), Src (Y416), and Erk (T202/Y204) kinases was detected by Western blotting in BEL-7404 cells and SMMC-7721 cells. After treatment with sulfatide, the cells were collected and lysed for the detection. Cells treated with Lacto-Cer or vehicle were tested as a control. (F) The densitometry analysis of Erk (left) and Src (right) phosphorylation is summarized. (G) Phosphorylation of c-Raf (Y341), JNK (T178), Rac (S71), and mTOR (S2481) was measured simultaneously in both SMMC-7721 and BEL-7404 cells. (H–L) Densitometry analysis of Raf-Y341 (H), Raf-S338 (I), p38-p (J), JNK-p (K), and RAC-P (L). All figures are from a representative study, and at least three additional experiments yielded similar results. *P < 0.05, **P <0.01.
Fig. 9.
Fig. 9.
Inactivation of Erk prevented Sp1 phosphorylation induced by sulfatide. (A) Prior to the treatment with sulfatide, BEL-7404 cells were preinhibited with 25 and 50 μM PD 98059, respectively, and assayed by Western blotting for the measurement of Erk1/2 (T202/Y204) and Sp1 (T739) phosphorylation. (B) The effect of MEK1/2 inhibitor on the phosphorylation of the Erk1/2 (T202/Y204) and Sp1 (T739) was assessed by Western blotting in both SMMC-7721 and BEL-7404 cells pretreated with 10 μM U0126 before sulfatide treatment (top panel). The graphs at the bottom summarize the densitometric analysis of Erk-p (left) and Sp1-p (right). All figures are from a representative study, and at least three additional experiments yielded similar results. *P < 0.05, **P < 0.01.

Similar articles

Cited by

References

    1. Schwartz M. A., Assoian R. K. 2001. Integrins and cell proliferation: regulation of cyclin-dependent kinases via cytoplasmic signaling pathways. J. Cell Sci. 114: 2553–2560. - PubMed
    1. Shimaoka M., Takagi J., Springer T. A. 2002. Conformational regulation of integrin structure and function. Annu. Rev. Biophys. Biomol. Struct. 31: 485–516. - PubMed
    1. Zahir N., Weaver V. M. 2004. Death in the third dimension: apoptosis regulation and tissue architecture. Curr. Opin. Genet. Dev. 14: 71–80. - PubMed
    1. Gao B., Saba T. M., Tsan M. F. 2002. Role of alpha(v)beta(3)-integrin in TNF-alpha-induced endothelial cell migration. Am. J. Physiol. Cell Physiol. 283: C1196–C1205. - PubMed
    1. Li H., Ge C., Zhao F., Yan M., Hu C., Jia D., Tian H., Zhu M., Chen T., Jiang G., et al. 2011. Hypoxia-inducible factor 1 alpha-activated angiopoietin-like protein 4 contributes to tumor metastasis via vascular cell adhesion molecule-1/integrin beta1 signaling in human hepatocellular carcinoma. Hepatology. 54: 910–919. - PubMed

Publication types

MeSH terms

LinkOut - more resources