. 2013 Feb 5;110(6):2324-9.
doi: 10.1073/pnas.1214136110. Epub 2013 Jan 23.

Mesothelial cells give rise to hepatic stellate cells and myofibroblasts via mesothelial-mesenchymal transition in liver injury

Affiliations

Mesothelial cells give rise to hepatic stellate cells and myofibroblasts via mesothelial-mesenchymal transition in liver injury

Yuchang Li et al. Proc Natl Acad Sci U S A. .

Abstract

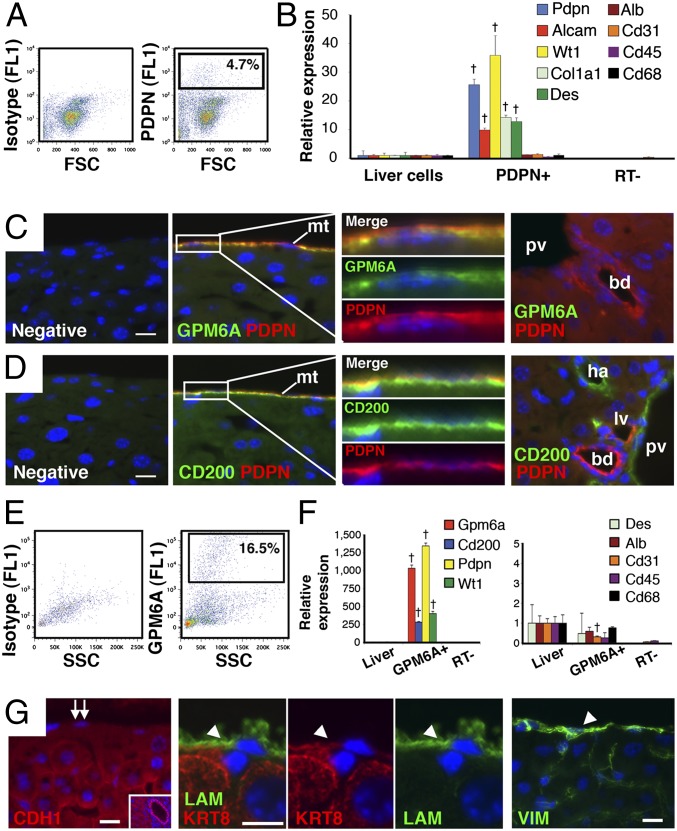
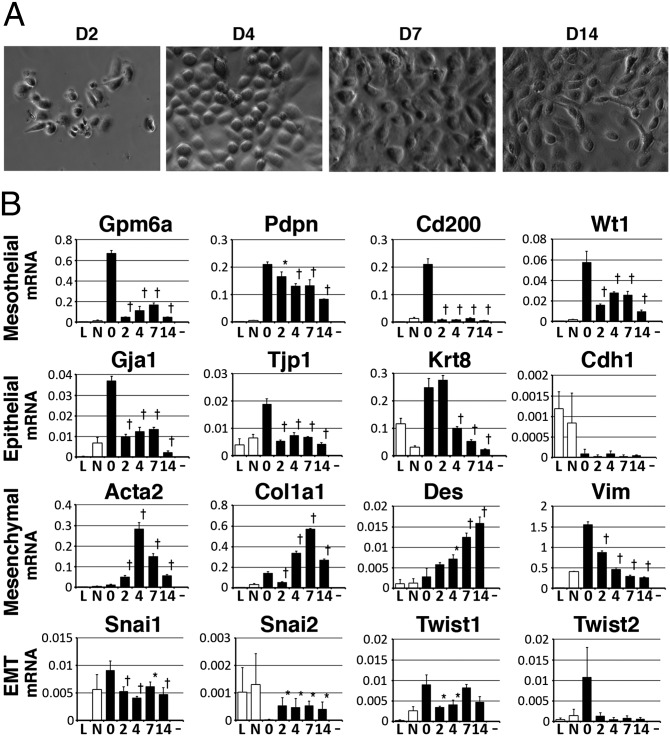
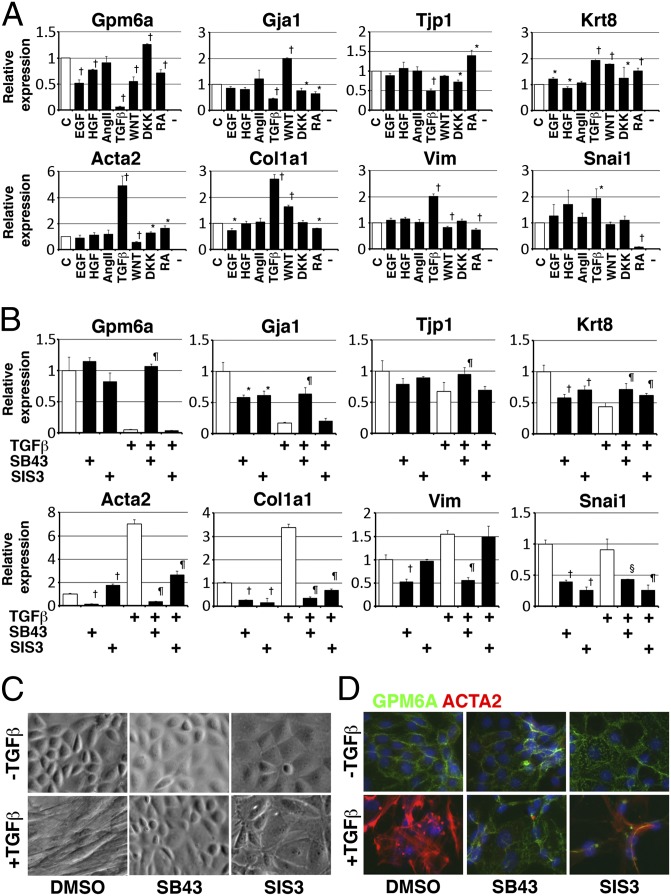
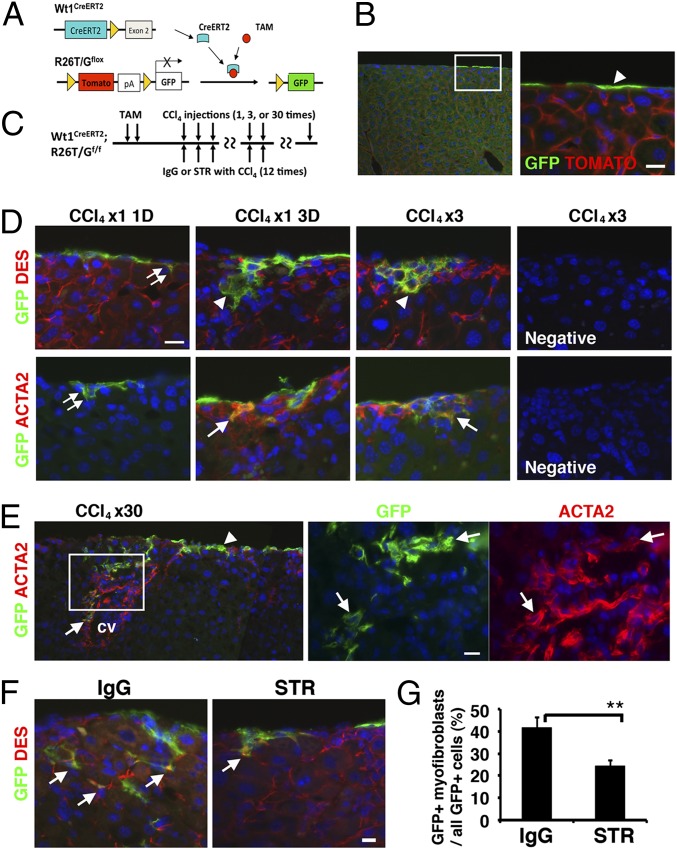
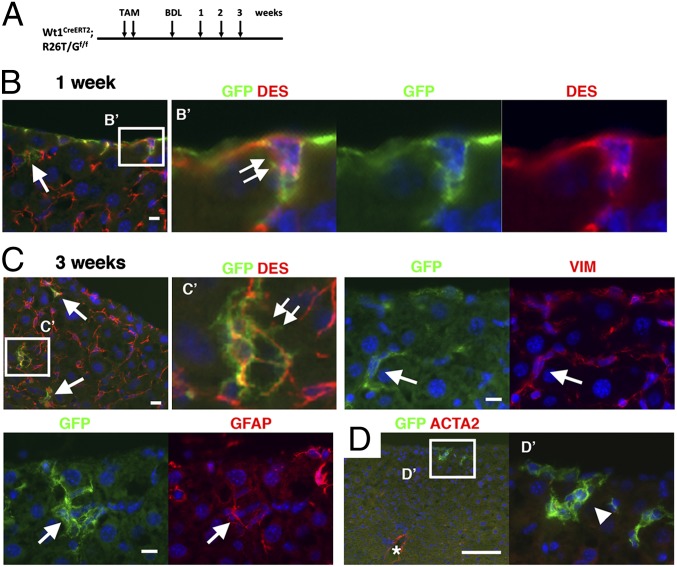
In many organs, myofibroblasts play a major role in the scarring process in response to injury. In liver fibrogenesis, hepatic stellate cells (HSCs) are thought to transdifferentiate into myofibroblasts, but the origins of both HSCs and myofibroblasts remain elusive. In the developing liver, lung, and intestine, mesothelial cells (MCs) differentiate into specific mesenchymal cell types; however, the contribution of this differentiation to organ injury is unknown. In the present study, using mouse models, conditional cell lineage analysis has demonstrated that MCs expressing Wilms tumor 1 give rise to HSCs and myofibroblasts during liver fibrogenesis. Primary MCs, isolated from adult mouse liver using antibodies against glycoprotein M6a, undergo myofibroblastic transdifferentiation. Antagonism of TGF-β signaling suppresses transition of MCs to mesenchymal cells both in vitro and in vivo. These results indicate that MCs undergo mesothelial-mesenchymal transition and participate in liver injury via differentiation to HSCs and myofibroblasts.


Conflict of interest statement

The authors declare no conflict of interest.

Figures

Fig. 1.
Fig. 1.
Identification of GPM6A as a liver MC-specific marker. (A) PDPN+ cells (4.7%) were sorted from E12.5 mouse embryonic livers using FACS and anti-PDPN antibodies. Isotype IgG was used as a negative control. (B) QPCR of the purified E12.5 PDPN+ cells and liver cells. P < 0.01 compared with liver cells. (C and D) Immunostaining of PDPN (red) and GPM6A or CD200 (green) in normal adult mouse livers. The surface mesothelium (mt) expresses PDPN, GPM6A, and CD200. The last panels show the portal area inside the liver. Immunostaining without the first antibody was used as negative controls. bd, bile duct; ha, hepatic artery; lv, lymphatic vessel; pv, portal vein. (E) GPM6A+ cells (16.5%) were sorted from adult mouse liver cells using FACS and anti-GPM6A antibodies. (F) QPCR of purified GPM6A+ cells in adult livers. P < 0.01 compared with liver cells. (G) Immunostaining of CDH1, LAM, KRT8, and VIM in adult mouse liver. MCs are negative for CDH1 (double arrows). Positive staining of CDH1 in the bile duct (Inset). Arrowheads indicate MCs expressing LAM, KRT8, and VIM. Nuclei were counterstained with DAPI. (Scale bar, 10 μm.)
Fig. 2.
Fig. 2.
Primary culture of liver MCs. MCs were purified from normal adult livers using anti-GPM6A antibodies and magnetic beads. (A) Morphology of primary liver MCs. (B) QPCR of MC, epithelial cell, mesenchymal cell, and EMT markers. Primary MCs decrease expression of MC and epithelial cell markers while increasing mesenchymal cell markers in culture. L, liver cells; N, GPM6A population. *P < 0.05, P < 0.01 compared with isolated MCs (day 0).
Fig. 3.
Fig. 3.
Conversion of MCs to mesenchymal cells by TGF-β in vitro. Primary MCs were cultured in the presence or absence of cytokines and chemical inhibitors. (A) QPCR of MCs treated with indicated factors 4 d (from days 1–5). TGF-β induces expression of mesenchymal cell markers while suppressing Gpm6a and many epithelial cell markers (not Krt8). *P < 0.05, P < 0.01 compared with MCs without treatment (c, control). (B) QPCR of MCs treated with TGF-β and/or inhibitors for 7 d. TGF-β induces expression of mesenchymal cell markers while suppressing Gpm6a. TGF-β weakly suppresses expression of epithelial cell markers including Krt8. SB431542 (SB43: TGF-βR1 inhibitor) suppresses the effect of TGF-β on MCs. SIS3 (SMAD3 inhibitor) suppresses up-regulation of mesenchymal cell markers in MCs induced by TGF-β. *P < 0.05, P < 0.01 compared with no treatment. §P < 0.05, P < 0.01 compared with TGF-β treatment. (C and D) Morphological and phenotypical changes in cultured MCs treated with TGF-β and/or inhibitors for 7 d. SB431542 keeps epithelial morphology and phenotype of MCs in the presence of TGF-β. SIS3 partially blocks morphological and phenotypical change of MCs by TGF-β.
Fig. 4.
Fig. 4.
Conditional MC lineage analysis in CCl4-induced liver fibrosis. (A) After TAM injection, Wt1+ MCs selectively convert expression of Tomato to membrane-tagged GFP in the Wt1CreERT2;R26T/Gf mouse liver. (B) Immunostaining of GFP in the liver 1 wk after TAM injections. Only MCs express GFP (arrowhead). (C) After labeling MCs by TAM injection, liver fibrosis was induced by CCl4 injection 1–30 times. For inhibition of TGF-β signaling, mice were treated with CCl4 injections 12 times and STR (TGF-βR2 Fc chimera) or IgG control for every 3 d. (D) Immunostaining of the liver for GFP, DES, and ACTA2. Double arrows indicate GFP+ MCs differentiating into DES+ ACTA2 HSCs 1 d after a single injection of CCl4. Arrowheads and arrows indicate DES+ GFP+ and ACTA2+ GFP+ myofibroblasts, respectively. Immunostaining without the first antibody was used as negative controls. (E) Immunostaining of GFP and ACTA2 after injections of CCl4 30 times. GFP+ MCs (arrowhead) migrate inward from the liver surface and coexpress ACTA2 (arrows) in the fibrotic septum. cv, central vein. (F) Immunostaining for GFP and DES after injections of CCl4 12 times cotreated with STR or control IgG. Arrows indicate DES+ GFP+ myofibroblasts derived from MCs. Nuclei were counterstained with DAPI. (Scale bar, 10 μm.) (G) Percentages of the GFP+ myofibroblasts in all GFP+ cells including both MCs and myofibroblasts in the control (IgG) and treated (STR) groups. Results are means ± SD of three mice. **P < 0.01.
Fig. 5.
Fig. 5.
Differentiation of MCs into HSCs in biliary fibrosis. (A) After labeling MCs in Wt1CreERT2;R26T/Gf mice by TAM injection, biliary fibrosis was induced by BDL. (BD) Immunostaining. Double arrows indicate GFP+ DES+ MCs, which seem to begin migration inward from the liver surface 1 wk after BDL (B) and GFP+ DES+ HSCs having dendritic processes (C). Arrows indicates GFP+ HSCs expressing DES, VIM, or GFAP. (D) An arrowhead and asterisk indicate ACTA2 GFP+ HSCs and ACTA2+ smooth muscle cells in the vein, respectively. Nuclei were counterstained with DAPI. [Scale bar, 10 μm (B and C) and 100 μm (D).]

Similar articles

Cited by

References

    1. Mutsaers SE. The mesothelial cell. Int J Biochem Cell Biol. 2004;36(1):9–16. - PubMed
    1. Yung S, Li FK, Chan TM. Peritoneal mesothelial cell culture and biology. Perit Dial Int. 2006;26(2):162–173. - PubMed
    1. Strippoli R, et al. Epithelial-to-mesenchymal transition of peritoneal mesothelial cells is regulated by an ERK/NF-kappaB/Snail1 pathway. Dis Model Mech. 2008;1(4-5):264–274. - PMC - PubMed
    1. Thiery JP, Acloque H, Huang RY, Nieto MA. Epithelial-mesenchymal transitions in development and disease. Cell. 2009;139(5):871–890. - PubMed
    1. Patel P, et al. Smad3-dependent and -independent pathways are involved in peritoneal membrane injury. Kidney Int. 2010;77(4):319–328. - PubMed

Publication types

MeSH terms

Associated data