. 2013 Feb 5;110(6):E488-97.
doi: 10.1073/pnas.1222099110. Epub 2013 Jan 23.

Pattern and synchrony of gene expression among sympatric marine microbial populations

Affiliations

Pattern and synchrony of gene expression among sympatric marine microbial populations

Elizabeth A Ottesen et al. Proc Natl Acad Sci U S A. .

Abstract

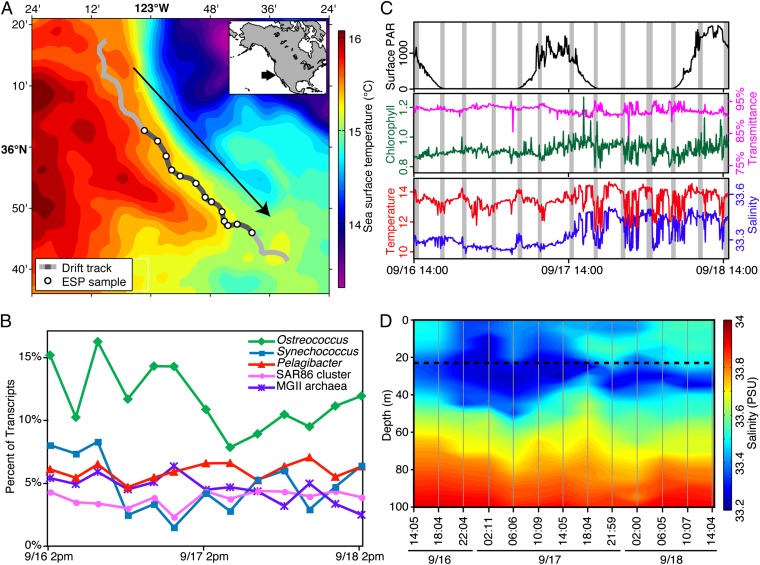
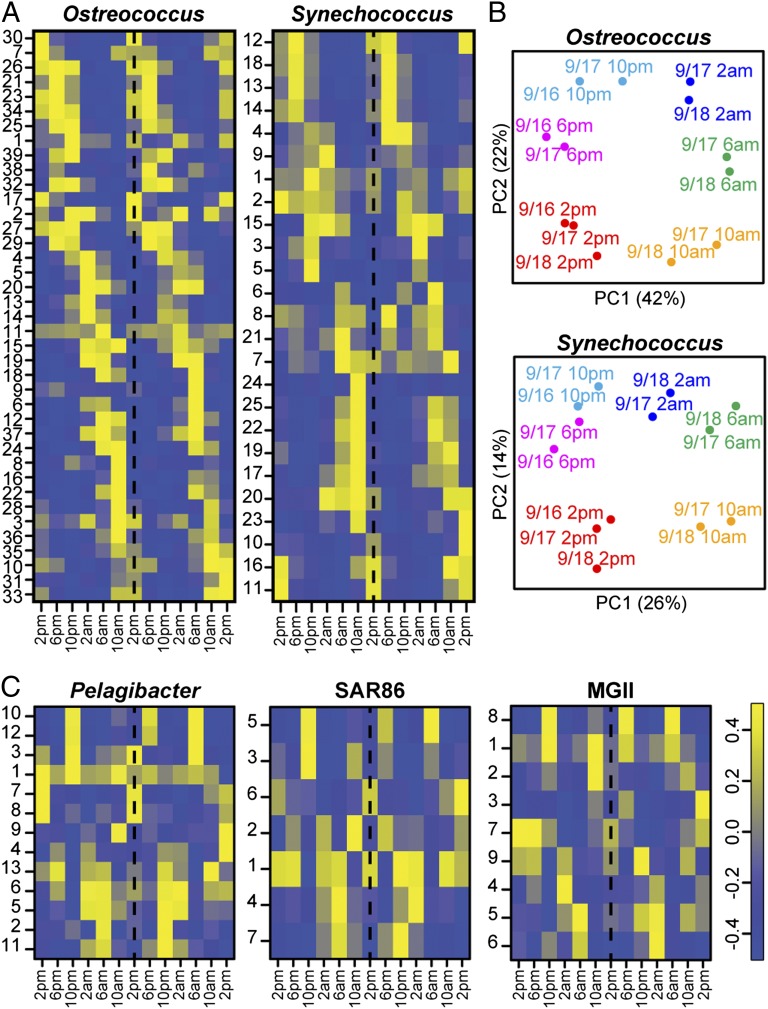
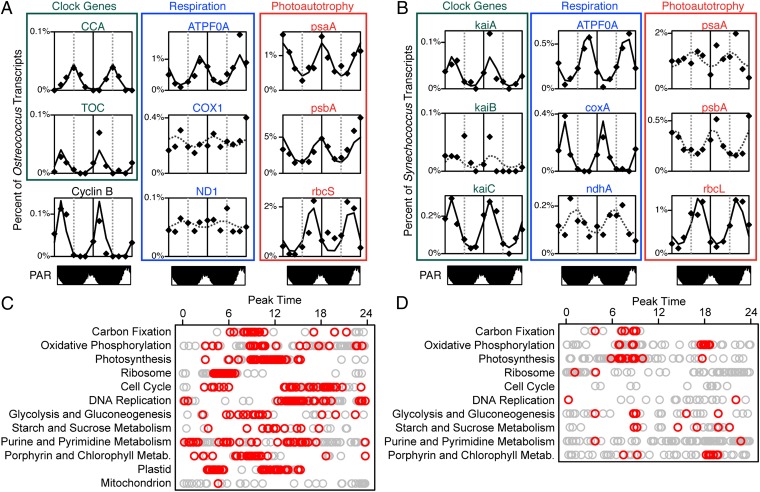
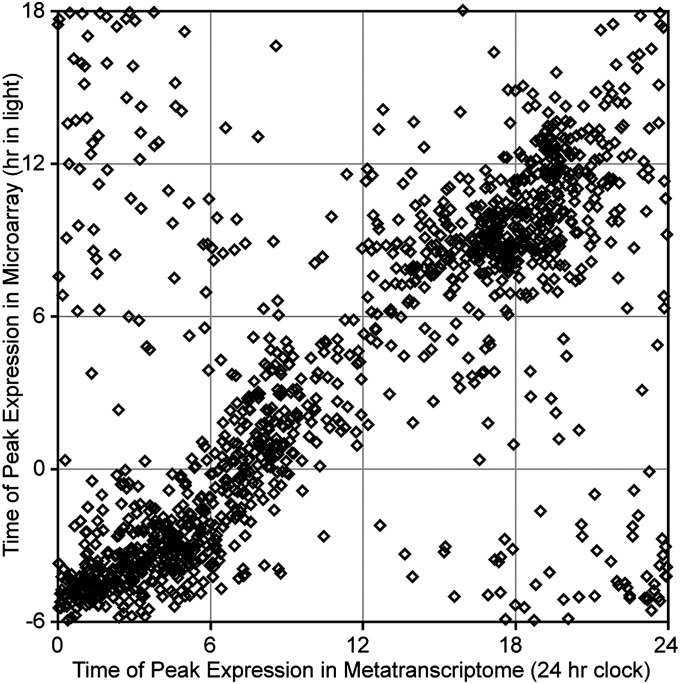
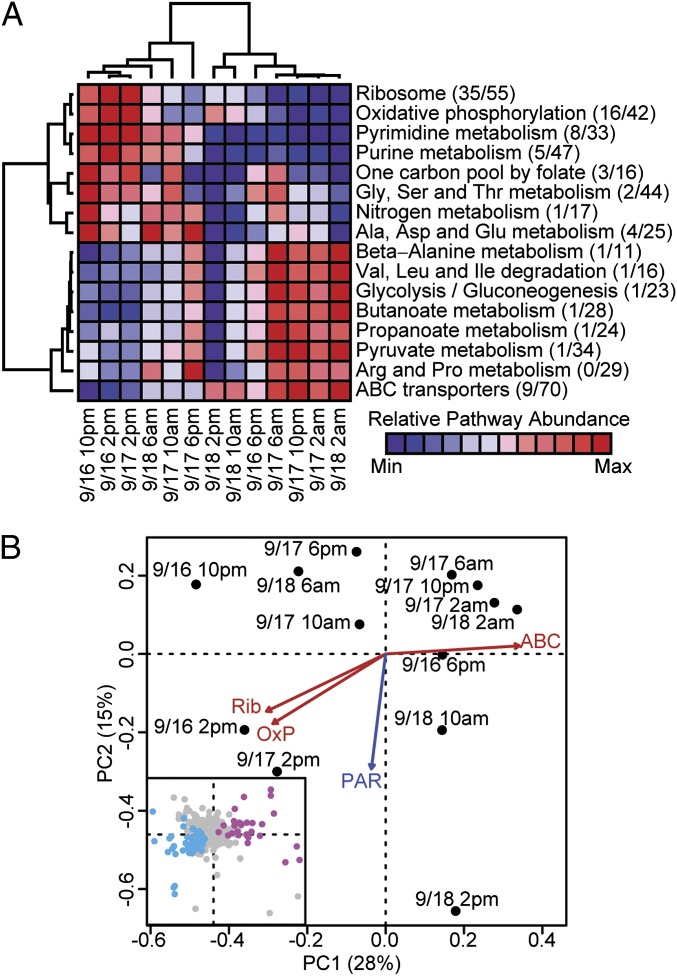
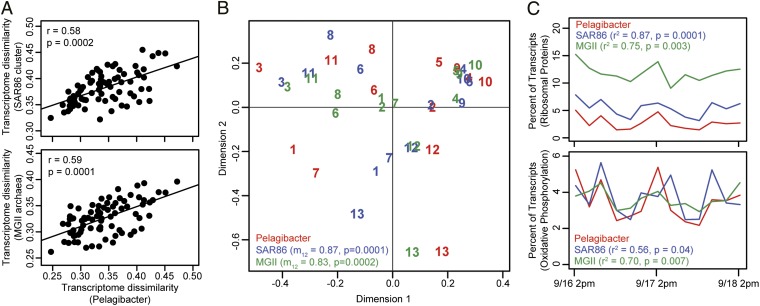
Planktonic marine microbes live in dynamic habitats that demand rapid sensing and response to periodic as well as stochastic environmental change. The kinetics, regularity, and specificity of microbial responses in situ, however, are not well-described. We report here simultaneous multitaxon genome-wide transcriptome profiling in a naturally occurring picoplankton community. An in situ robotic sampler using a Lagrangian sampling strategy enabled continuous tracking and repeated sampling of coherent microbial populations over 2 d. Subsequent RNA sequencing analyses yielded genome-wide transcriptome profiles of eukaryotic (Ostreococcus) and bacterial (Synechococcus) photosynthetic picoplankton as well as proteorhodopsin-containing heterotrophs, including Pelagibacter, SAR86-cluster Gammaproteobacteria, and marine Euryarchaea. The photosynthetic picoplankton exhibited strong diel rhythms over thousands of gene transcripts that were remarkably consistent with diel cycling observed in laboratory pure cultures. In contrast, the heterotrophs did not cycle diurnally. Instead, heterotrophic picoplankton populations exhibited cross-species synchronous, tightly regulated, temporally variable patterns of gene expression for many genes, particularly those genes associated with growth and nutrient acquisition. This multitaxon, population-wide gene regulation seemed to reflect sporadic, short-term, reversible responses to high-frequency environmental variability. Although the timing of the environmental responses among different heterotrophic species seemed synchronous, the specific metabolic genes that were expressed varied from taxon to taxon. In aggregate, these results provide insights into the kinetics, diversity, and functional patterns of microbial community response to environmental change. Our results also suggest a means by which complex multispecies metabolic processes could be coordinated, facilitating the regulation of matter and energy processing in a dynamically changing environment.


Conflict of interest statement

The authors declare no conflict of interest.

Figures

Fig. 1.
Fig. 1.
Sampling locations and sample characteristics. (A) The ESP drift track imposed over a map showing average sea surface temperature [Polar orbiting environment satellites, advanced very high resolution radiometer, local area coverage. Western United States, day/night, 5 × 5-pixel (5 × 5-km) median-filtered composite from September 21, 2010; cloud cover precluded satellite observation during the sampling period]. Inset shows the sampling location relative to western North America. (B) Transcript abundances of major taxa represented as percent of sequences with matches in the NCBInr peptide database. (C) Environmental conditions in the immediate vicinity of the ESP (measurements taken by ESP-mounted instruments). Grey bars represent sample collection times. (D) Integrated depth profile showing salinity gradients surrounding the sampling location (dotted line). Measurements were taken near the ESP by a ship-deployed instrument. The arrow in A indicates the direction of the drift.
Fig. 2.
Fig. 2.
Global transcriptional profiles from phototrophic and heterotrophic taxon bins. Heat maps depict third-order Fourier series models from geneARMA clustered transcripts within phototrophic (A) and heterotrophic (C) taxa. Heat maps show model amplitude at the 13 time points (columns) for each of the geneARMA clusters (rows). GeneARMA cluster models were normalized to an amplitude of one. Membership information and individual gene transcript traces are shown in SI Appendix, Figs. S13–S17. (B) Principal components analysis of Ostreococcus and Synechococcus transcriptomes. Axes represent the first and second principal components and are labeled with the percent of total variance explained.
Fig. 3.
Fig. 3.
Periodic gene expression in Ostreococcus- and Synechococcus-assigned transcripts. (A and B) 48-h time series of observed (points) and fitted (lines) transcript abundances is shown for selected transcripts from Ostreococcus (A) and Synechococcus (B) populations. Fitted values with solid lines represent transcripts with significantly periodic expression, whereas dotted lines represent best-fit curves for transcripts not passing significance cutoffs. For reference, plots of relative light levels are shown. (C and D) Plots showing peak expression times for all orthologs (grey circles) and significantly periodic orthologs (red circles) assigned to major cellular functions in Ostreococcus (C) and Synechococcus (D). KEGG pathways for photosynthesis proteins and antenna proteins were combined for the purposes of this plot along with purine and pyrimidine metabolism pathways. Ostreococcus (OC) and Synechococcus (SC) ortholog cluster designations for transcripts in A and B: ATPF0A, ATP synthase subunit A, OC 9555 (plastid-encoded), SC 1180; Circadian Clock Associated 1 (CCA1) and Timing of Cab expression 1 (TOC1), Ostreococcus clock genes OC 3107 and 7575; COX1, coxA, cytochrome c oxidase subunit I, OC 9595 (mitochondrial), SC 1503; Cyclin B, mitotic cyclin B, OC 658; kaiA, -B, and -C, Synechococcus clock genes SC 332, 3370, and 334; ND1, ndhA, NADH dehydrogenase I subunit 1, OC 9600 (mitochondrial), SC 210; PAR, photosynthetically available radiation; psaA, PSI apoprotein A1, OC 9562 (plastid-encoded), SC 2040; psbA, PSII reaction center D1, OC 9541 (plastid-encoded), SC 1091; rbcS, rbcL, RuBisCo large and small subunits, OC 6808, SC 130.
Fig. 4.
Fig. 4.
Comparison of peak expression times for periodically expressed Ostreococcus orthologs in field populations vs. a laboratory pure culture. Each point represents 1 of 1,290 transcripts detected as significantly periodic in our field study reported here and a previous microarray study of O. tauri (18). For this comparison, microarray data (as reported in Gene Expression Omnibus accession no. GSE16422) were reprocessed using our harmonic regression method with a Gaussian error model.
Fig. 5.
Fig. 5.
Analysis of Pelagibacter transcriptional profiles. (A) Heat map showing relative abundance of major metabolic pathways among Pelagibacter-assigned sequences. Hierarchical clustering of samples and pathways used average-linkage clustering based on Pearson correlation coefficients. For each pathway, the fraction of transcripts assigned to each pathway that is significantly correlated (based on Poisson regression) with the overall pathway-level signal is listed. (B) Principal components analysis of Pelagibacter transcriptional profiles. Axes represent the first two components and are labeled with the proportion of variance explained by each. Vector fits for selected KEGG pathways (ABC, ABC transporters; OxP, oxidative phosphorylation; Rib, ribosomal proteins) were highly significant (P < 0.0001) and are shown in red. Of the environmental data collected, only surface PAR (blue; P = 0.003) was significantly correlated (P < 0.05) with the ordination. (Inset) Loadings of Pelagibacter transcripts on the principal component axes. Transcripts significantly correlated with either ribosome or ABC transport pathways are colored based on their relationship with those pathways (cyan for orthologs positively correlated with ribosome and/or negatively correlated with ABC transport; magenta for the opposite relationship).
Fig. 6.
Fig. 6.
Synchronous transcriptional dynamics among three heterotrophic populations. (A) Mantel test showing a significant relationship in transcriptome dissimilarity for Pelagibacter vs. SAR86 (Upper) and MGII (Lower) populations. Comparisons used pairwise Euclidean distances (square root of the sum of squared differences in abundance for all transcripts). (B) Procrustes analysis revealing a large degree of congruence in sample clustering patterns for the three heterotrophic populations. In Procrustes tests, the results of principal components analyses are rotated and scaled to identify similarities in clustering patterns while maintaining relationships between samples. A smaller distance between points corresponding to a single sample reflects a more similar clustering pattern. Rotated and scaled SAR86 (blue) and MGII (green) analyses are overlaid on the Pelagibacter (red) results from Fig. 5B. Samples are labeled according to position in the time series (9/16 2:00 PM is sample 1). Procrustes correlation (m12 ) and permutation-based significances are shown for each comparison. (C) The relative abundance of transcripts for ribosomal proteins (Upper) and genes associated with oxidative phosphorylation (Lower) within each taxon bin at each time point. Pearson correlation coefficient and P value are listed for relative abundances of these pathways within the Pelagibacter vs. their abundances in SAR86 and MGII transcriptomes.

Similar articles

Cited by

References

    1. Karl DM. Nutrient dynamics in the deep blue sea. Trends Microbiol. 2002;10(9):410–418. - PubMed
    1. Frias-Lopez J, et al. Microbial community gene expression in ocean surface waters. Proc Natl Acad Sci USA. 2008;105(10):3805–3810. - PMC - PubMed
    1. Gilbert JA, et al. Detection of large numbers of novel sequences in the metatranscriptomes of complex marine microbial communities. PLoS One. 2008;3(8):e3042. - PMC - PubMed
    1. Poretsky RS, et al. Comparative day/night metatranscriptomic analysis of microbial communities in the North Pacific subtropical gyre. Environ Microbiol. 2009;11(6):1358–1375. - PubMed
    1. Hewson I, Poretsky RS, Tripp HJ, Montoya JP, Zehr JP. Spatial patterns and light-driven variation of microbial population gene expression in surface waters of the oligotrophic open ocean. Environ Microbiol. 2010;12(7):1940–1956. - PubMed

Publication types

MeSH terms