. 2013 Apr;87(7):3628-39.
doi: 10.1128/JVI.03239-12. Epub 2013 Jan 23.

Enhanced autointegration in hyperstable simian immunodeficiency virus capsid mutants blocked after reverse transcription

Affiliations

Enhanced autointegration in hyperstable simian immunodeficiency virus capsid mutants blocked after reverse transcription

Christopher Tipper et al. J Virol. 2013 Apr.

Abstract

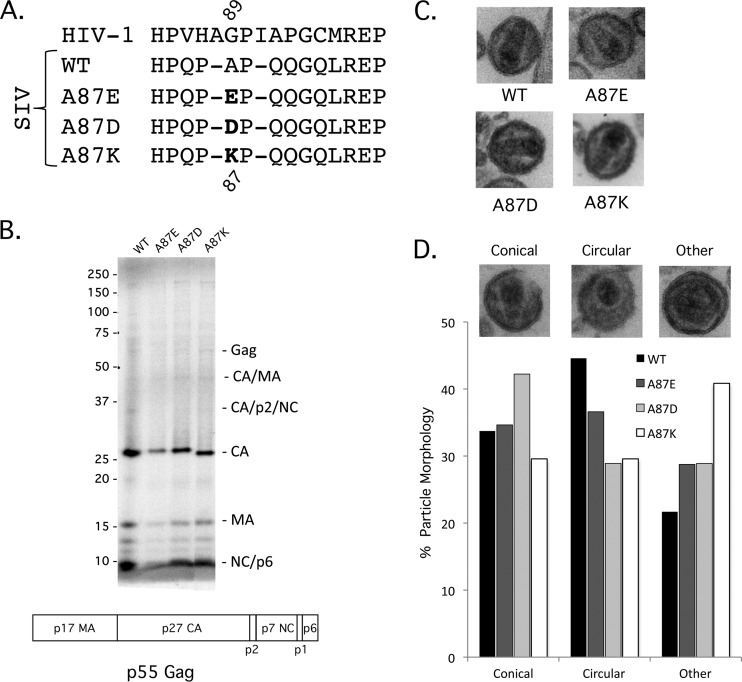
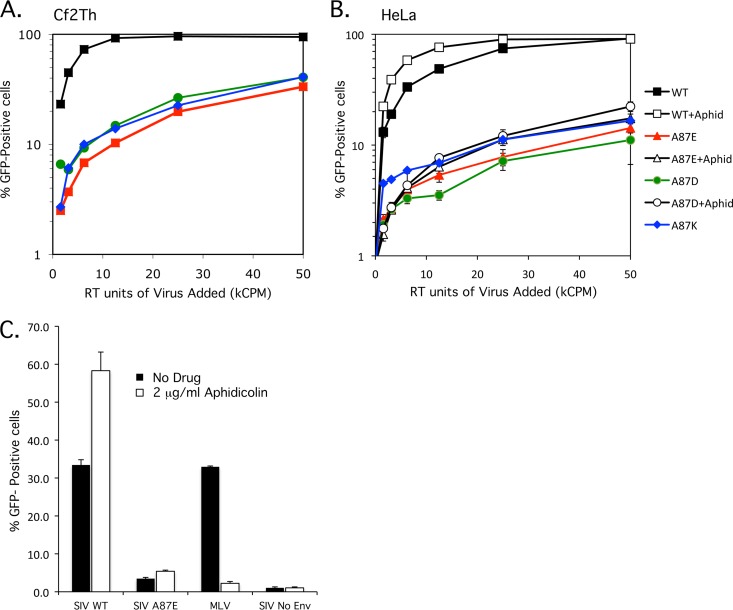
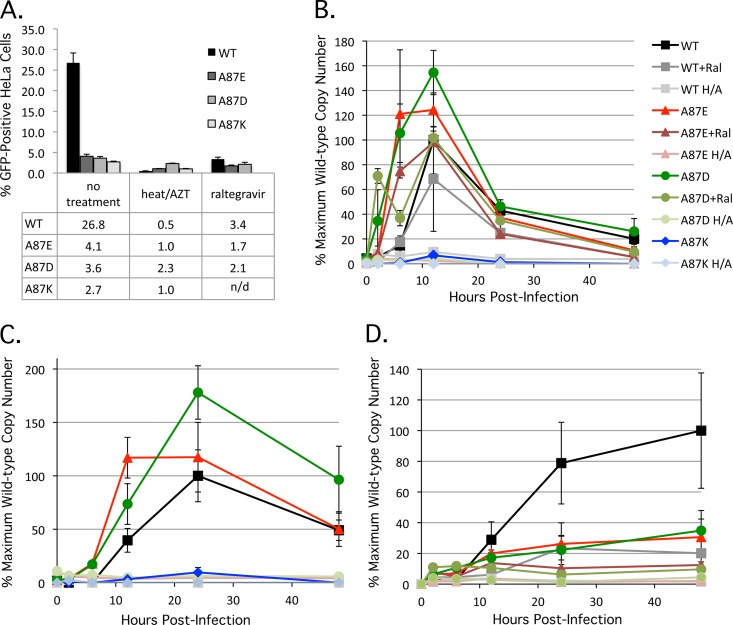
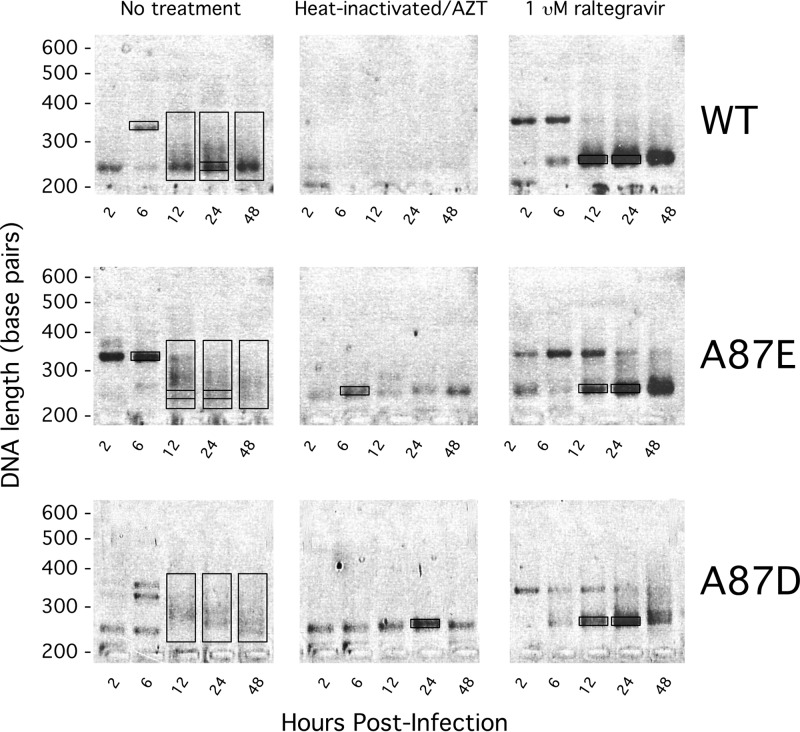
After entering a host cell, retroviruses such as simian immunodeficiency virus (SIV) uncoat, disassembling the viral capsid. Rates of uncoating that are too high and too low can be detrimental to the efficiency of infection. Rapid uncoating typically leads to blocks in reverse transcription, but the basis for replication defects associated with slow uncoating is less clear. Here we characterize the phenotypes of two SIVmac239 mutants with changes, A87E and A87D, in the helix 4/5 loop of the capsid protein. These mutant viruses exhibited normal capsid morphology but were significantly attenuated for infectivity. The infectivity of wild-type and mutant SIVmac239 was not decreased by aphidicolin-induced growth arrest of the target cells. In the cytosol of infected cells, the A87E and A87D capsids remained in particulate form longer than the wild-type SIVmac239 capsid, suggesting that the mutants uncoat more slowly than the wild-type capsid. Both mutants exhibited much higher levels of autointegrated DNA forms than wild-type SIVmac239. Thus, some changes in the helix 4/5 loop of the SIVmac239 capsid protein result in capsid hyperstability and an increase in autointegration.


Figures

Fig 1
Fig 1
Gag precursor processing and core morphology of SIVmac239 capsid variants. (A) The central portion of the SIVmac239 helix 4/5 loop is shown, comparing the sequences of HIV-1 and wild-type (WT) SIVmac239 and the A87E, A87D, and A87K mutants. (B) The processing of the Gag precursor polyprotein was examined by metabolically labeling transfected HEK293T cells producing WT and mutant SIVmac239 virions. Secreted viruses were collected, purified over a 20% sucrose column, and run on a 12% Bis-Tris gel. Loading was normalized by the amount of 35S label. The domain organization of the SIVmac239 p55 Gag precursor polyprotein is illustrated beneath the gel. (C) To examine virion morphology, purified virions were pelleted, stained, and examined by electron microscopy. (D) Virion particles for each variant were identified and then binned according to their core morphology: conical, circular, or “other.” Examples of each are displayed above the category axis (wild type, n = 153; A87E, n = 166; A87D, n = 135; A87K, n = 213).
Fig 2
Fig 2
Infectivity of wild-type and mutant SIVmac239. (A and B) VSV-G-pseudotyped recombinant SIVmac239 viruses were produced in transfected HEK293T cells, and reverse transcriptase activity was measured. Increasing amounts of the WT, A87E, A87D, and A87K viruses, which express GFP, were used to infect Cf2Th (A) or HeLa (B) cells. The percentage of infected, GFP-positive cells was assayed at 48 h postinfection by FACS analysis. (B) Aphidicolin (2 μg/ml) was added to one set of the HeLa target cells (+aphid). The results shown are typical of those obtained in 3 independent experiments. (C) HeLa cells were infected with identical amounts (in RT units) of VSV-G-pseudotyped GFP-expressing recombinant WT and A87E SIV and, as a control, MLV. In some cases, 2 μg/ml aphidicolin was added to the HeLa cells. GFP-positive cells were measured by FACS analysis 48 h after infection. The means and standard deviations of the results obtained in 3 independent experiments are shown.
Fig 3
Fig 3
Fate of the wild-type and mutant SIVmac239 capsids in infected cells. Cf2Th cells were incubated at 37°C with equivalent concentrations of VSV-G-pseudotyped viruses, based on RT units. At the indicated times, the infected cells were mechanically disrupted, and their cytosolic fractions were layered atop a 50% sucrose column, saving some to measure the “input.” After centrifugation, a “soluble” capsid sample was removed from near the top of the column, and the pelletable capsid was collected at the bottom of the tube following column removal. Input, soluble, and pelletable fractions were loaded onto a 4 to 12% Bis-Tris gel, Western blotted, and probed with anti-SIVmac251 polyclonal antibody. (A) The results of a single experiment are shown, with the fate of capsid measured at 16 h postinfection (p.i.). (B) Three independent infections were assayed for pelletable capsid at 16 h postinfection. The amounts of pelletable capsid were determined by densitometric analysis of Western blots, adjusted for input and normalized to the signal for WT SIVmac239, which was set at 100%. The A87E and A87D mutants had significantly more pelletable capsid than wild-type SIVmac239 (*, P < 0.01). (C) Time course of the fate of the capsid in infected cells. After the initiation of infection, the amounts of input and pelletable fractions containing CA were assayed every 4 h until 28 h postinfection. A parallel infection of recombinant WT SIVmac239 without a VSV-G glycoprotein (no Env) was used as a negative control. Data from one of two independent experiments, which generated similar results, are shown.
Fig 4
Fig 4
Reverse transcription and integration of SIVmac239 variants. (A) Three independent infections of HeLa cells with wild-type and mutant SIVmac239 at a multiplicity of infection of approximately 0.5 were performed, and the percentage of infected, GFP-positive cells was assayed at 48 h postinfection, as described in the Fig. 2 legend. In some experiments, the viruses were incubated at 56°C for 1 h, and the cells were treated with 100 mM AZT (“heat/AZT”). In another set of experiments, 1 μM raltegravir was added to the infected cells. In the experiment shown, the value obtained for the heat-inactivated, AZT-treated A87D mutant is atypically high due to stochastic autofluorescence of the HeLa cells after treatment with 100 μM AZT. n/d, not determined. (B) To assess the production of late reverse transcripts, total DNA was extracted from infected HeLa cells at 2, 6, 12, 24, and 48 h postinfection. Late reverse transcript copy numbers were determined by quantitative real-time PCR (H/A, heat inactivation of virus plus AZT treatment of target cells, as described above; Ral, raltegravir treatment [1 μM] of target cells, as described above). The values shown represent the percentages of the maximum wild-type SIVmac239 value (7,245 copies/100 ng DNA at 12 h postinfection). (C) The production of 2-LTR circles was assessed as described in Materials and Methods. Heat inactivation of viruses plus AZT treatment of target cells was carried out as described above. The values shown represent the percentages of the maximum wild-type SIVmac239 value (552 copies/100 ng DNA at 24 h postinfection). (D) The production of integrated proviruses was assessed as described in Materials and Methods. Heat inactivation of viruses plus AZT treatment of target cells and raltegravir treatment of target cells were carried out as described above. The values shown represent the percentages of the maximum wild-type SIVmac239 value (4,725 copies/100 ng DNA at 48 h postinfection).
Fig 5
Fig 5
Production of 2-LTR circles in infected cells. Recombinant viruses were used to infect HeLa cells, and at the indicated times, the levels of 2-LTR circles were measured by real-time PCR. Both a standard probe (2-LTR), which detects all 2-LTR circles, and a probe (JNCT) specific for canonical 2-LTR junctions were used. Some infected cells were treated with 1 μM raltegravir (Ral). The results for infections by wild-type (WT) SIVmac239 (A) and the A87E (B) and A87D (C) mutants are shown. The values shown represent the percentages of the maximum wild-type SIVmac239 value (823 copies/100 ng DNA at 24 h postinfection after raltegravir treatment). The results shown represent the averages and standard deviations derived from three independent infections.
Fig 6
Fig 6
Size analysis of 2-LTR products. HeLa cells were infected by recombinant wild-type (WT) and A87E and A87D mutant SIVmac239. At the indicated times after infection, 2-LTR circles were amplified by qPCR using the standard 2-LTR primer set. The products of the qPCRs were run on a 2% agarose gel and stained with ethidium bromide. For some of the experiments, the viruses were heated at 56°C for 1 h, and the cells were treated with 100 mM AZT. In another set of experiments, cells were treated with 1 μM raltegravir. The boxes indicate the material excised and sequenced and are denoted (from left to right and top to bottom) as follows: WT 6-h background, WT 12-h smear, WT 24-h smear and ∼210 bp (within smear), WT 48-h smear, WT plus raltegravir at 12 h and 24 h and ∼210 bp, A87E 6-h background, A87E 12-h smear and ∼210 bp, A87E 24-h smear and ∼210 bp, A87E 48-h smear, A87E 6-h heat-inactivated background, A87E plus raltegravir at 12 h and 24 h and ∼210 bp, A87D 12-h smear, A87D 24-h smear, A87D 48-h smear, A87D 24-h heat-inactivated background, and A87D plus raltegravir at 12 h and 24 h and ∼210 bp.
Fig 7
Fig 7
Four classes of LTR junctions amplified by the standard 2-LTR primer set. Products excised from the gel shown in Fig. 6 were ligated into a TOPO-TA cloning vector and transformed into E. coli DH5α, and individual colonies were sent for sequencing. The sequenced LTR junctions could be grouped into four classes. Class I junctions are unprocessed and ligated LTRs, as expected for a true 2-LTR circle. Class II and class III junctions apparently result from autointegration. Class II junctions have a processed 3′ LTR that joins a random point within the viral genome. Class III junctions have a processed 5′ LTR joined to a viral sequence. Class IV junctions are created by an unknown process and most often consist of junctions in which both 5′ and 3′ LTR ends have undergone deletions.
Fig 8
Fig 8
Frequency of production of canonical 2-LTR junctions. For each time point following infection of HeLa cells by wild-type (WT) and mutant SIVmac239, the total number of 2-LTR circles was measured by real-time qPCR with a standard 2-LTR probe (see the Fig. 5 legend). In parallel, the number of 2-LTR circles with canonical 2-LTR circle junctions was measured with a specific junctional probe. The number of canonical 2-LTR junctions is shown as a percentage of the total 2-LTR circle junctions observed, with or without raltegravir treatment of the target cells. The asterisks indicate values less than 1%.

Similar articles

Cited by

References

    1. Coffin JM, Hughes SH, Varmus H. 1997. Retroviruses. Cold Spring Harbor Laboratory Press, Plainview, NY - PubMed
    1. Bukrinsky MI, Sharova N, Dempsey MP, Stanwick TL, Bukrinskaya AG, Haggerty S, Stevenson M. 1992. Active nuclear import of human immunodeficiency virus type 1 preintegration complexes. Proc. Natl. Acad. Sci. U. S. A. 89:6580–6584 - PMC - PubMed
    1. Forshey BM, von Schwedler U, Sundquist WI, Aiken C. 2002. Formation of a human immunodeficiency virus type 1 core of optimal stability is crucial for viral replication. J. Virol. 76:5667–5677 - PMC - PubMed
    1. Leschonsky B, Ludwig C, Bieler K, Wagner R. 2007. Capsid stability and replication of human immunodeficiency virus type 1 are influenced critically by charge and size of Gag residue 183. J. Gen. Virol. 88:207–216 - PubMed
    1. Li Y, Kar AK, Sodroski J. 2009. Target cell type-dependent modulation of human immunodeficiency virus type 1 capsid disassembly by cyclophilin A. J. Virol. 83:10951–10962 - PMC - PubMed

Publication types

MeSH terms

LinkOut - more resources