. 2013 Mar 1;41(5):3068-78.
doi: 10.1093/nar/gkt015. Epub 2013 Jan 23.

Prevalent coordination of mitochondrial DNA transcription and initiation of replication with the cell cycle

Affiliations

Prevalent coordination of mitochondrial DNA transcription and initiation of replication with the cell cycle

Laurent Chatre et al. Nucleic Acids Res. .

Abstract

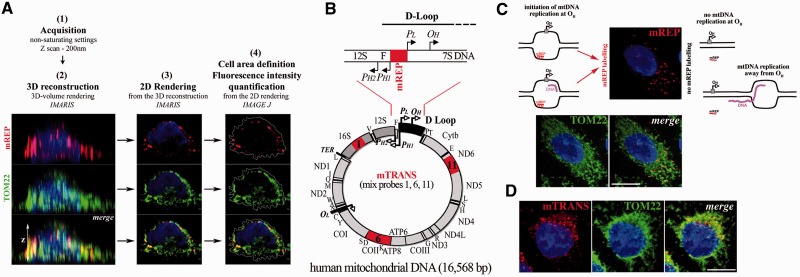
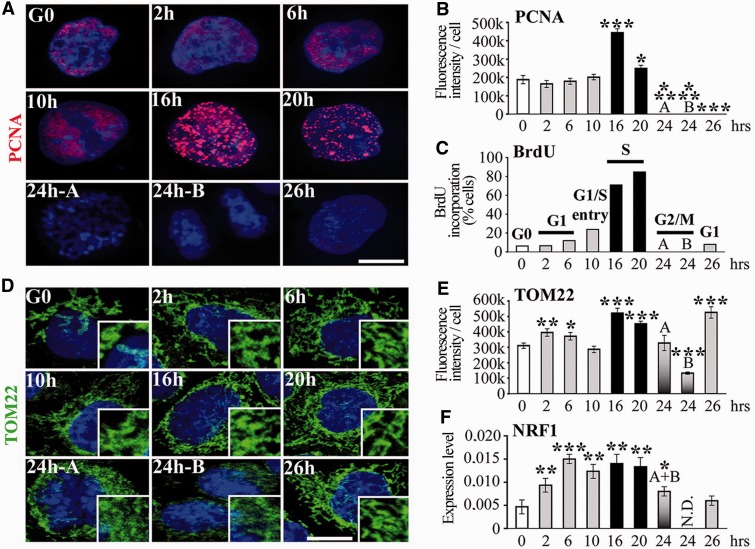
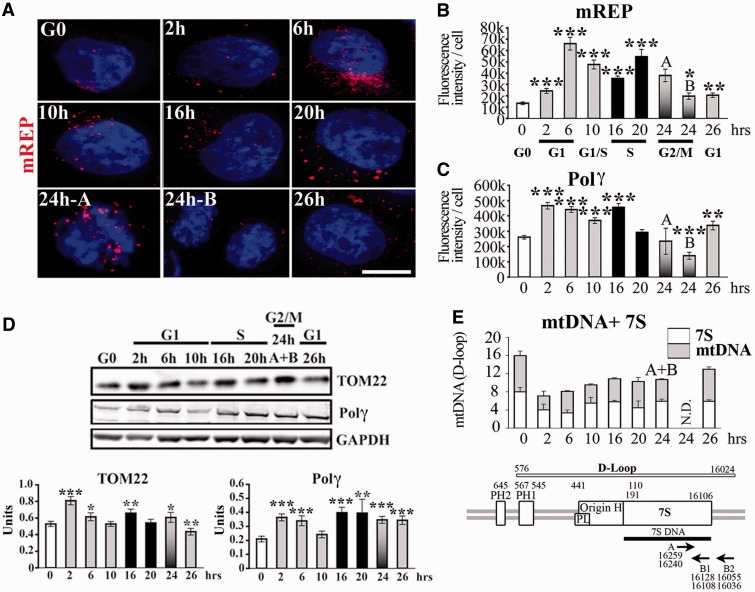
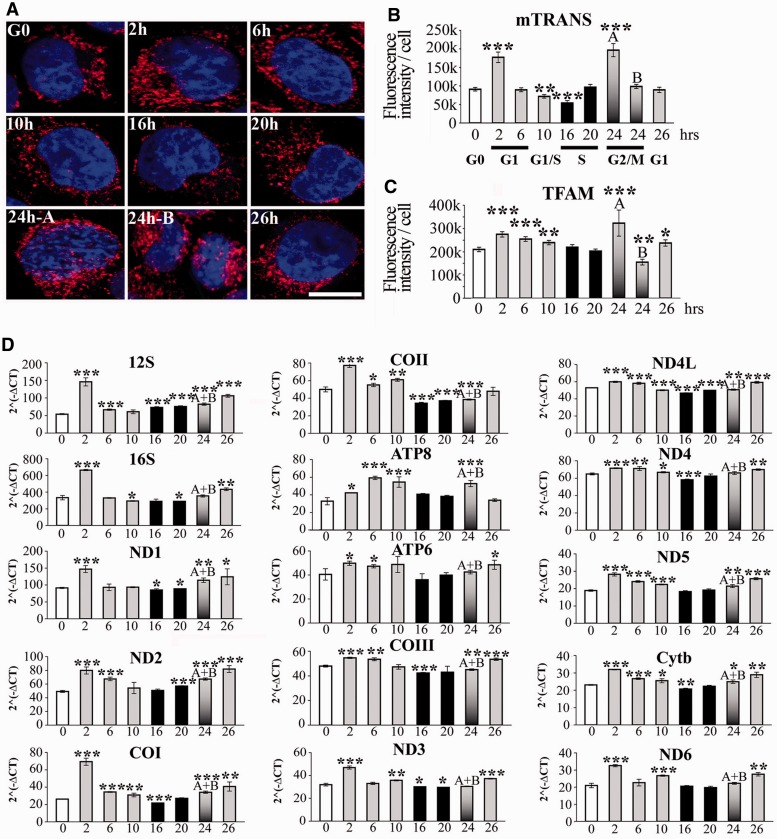
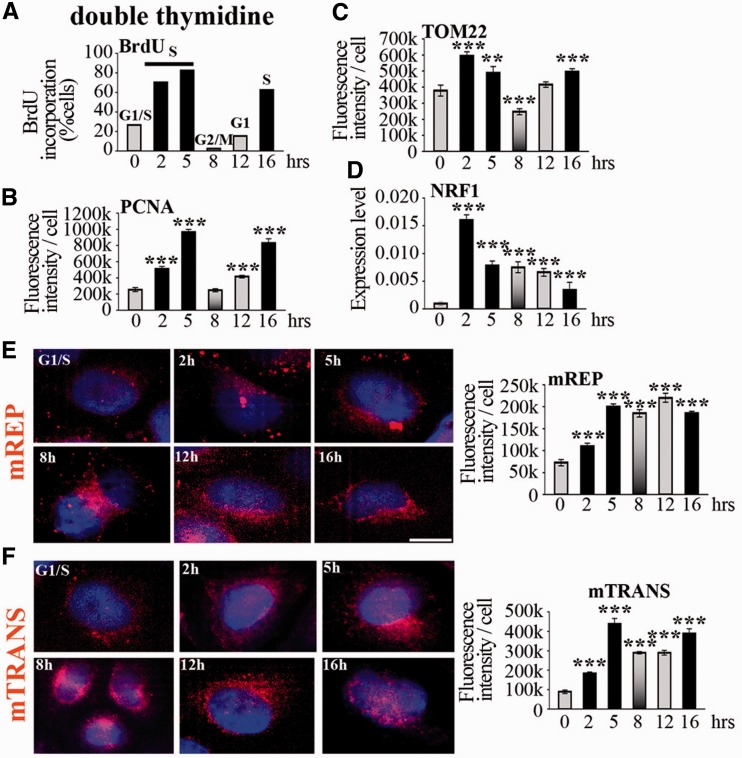
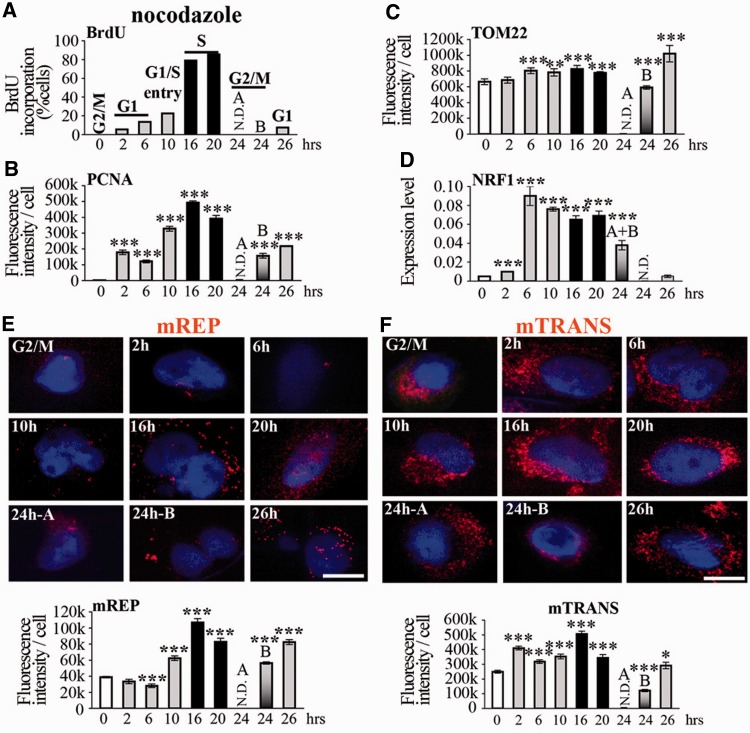
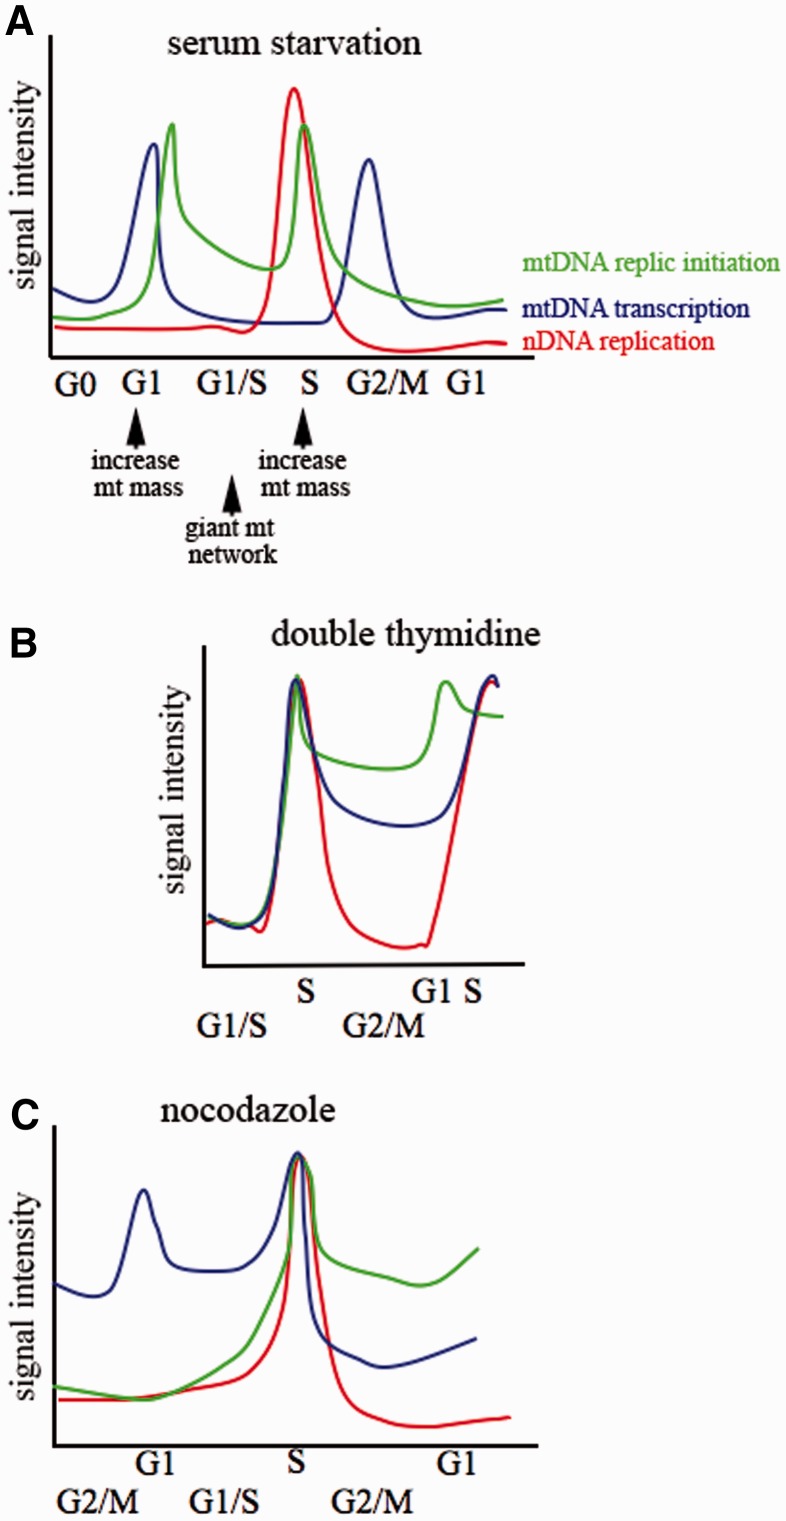
Nuclear (nDNA) and mitochondrial DNA (mtDNA) communication is essential for cell function, but it remains unclear whether the replication of these genomes is linked. We inspected human cells with a novel fluorescence in situ hybridization protocol (mitochondrial Transcription and Replication Imaging Protocol) that identifies mitochondrial structures engaged in initiation of mtDNA replication and unique transcript profiles, and reconstruct the temporal series of mitochondrial and nuclear events in single cells during the cell cycle. We show that mtDNA transcription and initiation of replication are prevalently coordinated with the cell cycle, preceding nuclear DNA synthesis, and being reactivated towards the end of S-phase. This coordination is achieved by modulating the fraction of mitochondrial structures that intiate mtDNA synthesis and/or contain transcript at a given time. Thus, although replication of the mitochondrial genome is active through the entire cell cycle, but in a limited fraction of mitochondrial structures, peaks of these activities are synchronized with nDNA synthesis. After release from blockage of mtDNA replication with either nocodazole or double thymidine treatment, prevalent mtDNA and nDNA synthesis occurred simultaneously, indicating that mitochondrial coordination with the nuclear phase can be adjusted in response to physiological alterations. These findings will help redefine other nuclear-mitochondrial links in cell function.


Figures

Figure 1.
Figure 1.
Experimental paradigm of FISH labelling with the mTRIP protocol. (A) Scheme of the 3D analysis of cells labelled with the mTRIP protocol (in this case probe mREP, upper panels, red) and also immunolabelled with TOM22 (middle panels, green). Merge is shown in lower panels. Steps 1–4 of data acquisition and processing are indicated. Briefly, optical z-slices of confocal acquisitions were 3D reconstructed, and then 2D volume rendered for fluorescence quantification, using the entire cell surface. (B) Schematic representation of the human mitochondrial genome (circular, below), and detail of the D-loop region at the level of the main replication origin (linear, above). The D-loop extends shortly beyond the 7S locus. In red are indicated the regions recognized by FISH probes used in this study (mREP and mTRANS). Single genes are indicated (tRNA genes with the corresponding letter). Ribosomal RNAs (16S and 12S) are in dark grey. The D-loop region is shown in black in the circular genome. PL and PH1–PH2, promoters of the L and H strand, respectively; OH, H-strand origin of replication. Probe mTRANS (mix of probes 1, 6 and 11, in red on the mt genome) labels only RNA, and includes 16S rRNA as well as mRNAs and tRNAs (see corresponding genes in the circular map). (C) Probe mREP (in red) recognizes only DNA in open structure (28). Scheme on the left represents structures that are recognized by probe mREP within an open replication bubble either with or without DNA synthesis (the new DNA chain is in purple). Position of the origin OH is indicated with a grey square, and the direction of replication with an arrow. Scheme on the right indicates structures that are not recognized by probe mREP because the replication bubble is either not formed at the level of OH (no DNA replication) or it is present in a region far from OH (elongating mtDNA). The mREP probe is indicated either as bound to the DNA (hatches represent hydrogen bonds) or unbound (line). Images show mTRIP labelling with probe mREP (see red foci) and immunostaining of the mitochondrial protein TOM22 (green) in a HeLa cell. Merge shows the distribution of mREP-labelled mitochondrial structures (initiation of mtDNA replication) within the mitochondrial network. (D) HeLa cell labelled with probe mTRANS and with anti-TOM22. Merge shows the distribution of transcript-rich mitochondrial structures (mTRANS) within the mitochondrial network. Scale bars = 10 µm.
Figure 2.
Figure 2.
Mitochondrial biogenesis during the cell cycle. (A) 3D-reconstructed HeLa cells synchronized in G0 by serum starvation. Anti-PCNA labelling (red) identifies phase of cell cycle. (B) Fluorescence intensity quantification of PCNA labelling. (C) Percentage of cells that incorporate BrdU (S-phase). Phases of cell cycle are indicated on top of columns. Code colours are constant for the histograms. (D) 3D-reconstructed HeLa cells immunostained with anti-TOM22 (green) to label the mitochondrial network. Cells in G2/M: pre-mitotic ‘A’ and post-mitotic ‘B’, according to the size of the nuclei. Magnification of the mitochondrial network is shown on the right low corner of each time point. (E) Fluorescence intensity quantification of TOM22 labelling. (F) RT-qPCR of mitochondrial biogenesis marker NRF1. n = 3. G2/M ‘A’ and ‘B’ cells cannot be separated in RT-qPCR experiments (single A + B column). t-test, each time point was compared with G0. Scale bars = 10 μm.
Figure 3.
Figure 3.
Initiation of mtDNA replication during the cell cycle. (A) 3D-reconstructed HeLa cells synchronized in G0 by serum starvation and labelled with the mREP probe (red). Scale bar = 10 μm. Fluorescence intensity quantification of (B) mREP, and (C) Polγ (images shown in Supplementary Figure S2A). (D) Western blot of TOM22, Polγ and loading control GAPDH protein (upper panel). Quantification of signal for TOM22 and Polγ is expressed in arbitrary units normalized to GAPDH (lower panels). (E) Estimation of 7S DNA and mtDNA content by qPCR using primers described (27); see scheme below for position; n = 3. t-test, each time point was compared with G0.
Figure 4.
Figure 4.
Transcription of the mitochondrial genome during the cell cycle. (A) 3D-reconstructed synchronized HeLa cells labelled with mTRANS probe (red), and Hoechst (blue). Scale bar = 10 μm. Fluorescence intensity quantification of (B) mTRANS, and (C) TFAM. (D) RT-qPCR analysis of the individual mitochondrial genes during the cell cycle (x-axis, h). n = 3. t-test, each time point was compared with G0.
Figure 5.
Figure 5.
Initiation of mtDNA replication and transcription in cells synchronized with double thymidine. (A) BrdU incorporation and (B) anti-PCNA immunostaining identify phases of cell cycle, indicated on top of columns in (A). The code colour is constant for histograms. (C) Quantification of TOM22 immunofluorescence during cell cycle. For cell size measurement, see Supplementary Figure S1. (D) Expression of NRF1 during cell cycle analysed by RT-qPCR; n = 3. t-test, each time point was compared with G1/S. (E) mREP and (F) mTRANS labelling (red) in 3D-reconstructed cells during the cell cycle; scale bar = 10 µm. Fluorescence intensity quantification is indicated on the right.
Figure 6.
Figure 6.
Initiation of mtDNA replication and transcription in cells synchronized with nocodazole. Treatment with nocodazole. Legend as in Figure 5. t-test, each time point was compared with G2/M.
Figure 7.
Figure 7.
Schematic representation of the temporal consequent series of mitochondrial and nuclear events during the cell cycle. Cell cycle synchronized by (A) serum starvation, (B) double thymidine and (C) nocodazole. nDNA replication as from BrdU incorporation, mtDNA initiation of replication as from mREP labelling, mitochondrial transcription from mTRANS labelling and RT-qPCR of mitochondrial transcripts. x-axis and y-axis coordinates are arbitrarily represented. X-axis is shifted to place S-phases at the same point for the three synchronization procedures. Arrows below panel (A) indicate the increase of the mitochondrial mass, as from TOM22 immunolabelling, and formation of the giant mitochondrial network promoting G1 to S transition as from reference (26). The same colour code is used for the three panels.

References

    1. Chen XJ, Butow RA. The organization and inheritance of the mitochondrial genome. Nat. Rev. Genet. 2005;6:815–825. - PubMed
    1. Scarpulla RC. Transcriptional paradigms in mammalian mitochondrial biogenesis and function. Physiol. Rev. 2008;88:611–638. - PubMed
    1. Rotig A, Poulton J. Genetic causes of mitochondrial DNA depletion in humans. Biochim. Biophys. Acta. 2009;1792:1103–1108. - PubMed
    1. Li H, Liu D, Lu J, Bai Y. Physiology and pathophysiology of mitochondrial DNA. Adv. Exp. Med. Biol. 2012;942:39–51. - PMC - PubMed
    1. Hoppins S, Lackner L, Nunnari J. The machines that divide and fuse mitochondria. Annu. Rev. Biochem. 2007;76:751–780. - PubMed

Publication types

Substances