

Network graph analysis of gene-gene interactions in genome-wide association study data
- PMID: 23346039
- PMCID: PMC3543927
- DOI: 10.5808/GI.2012.10.4.256
Network graph analysis of gene-gene interactions in genome-wide association study data
Abstract
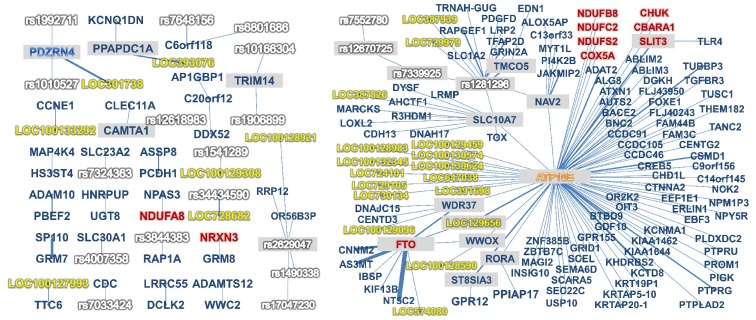
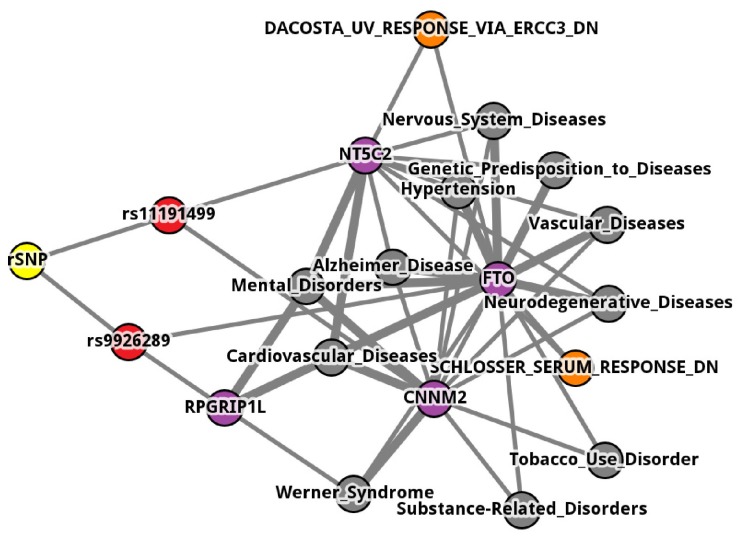
Most common complex traits, such as obesity, hypertension, diabetes, and cancers, are known to be associated with multiple genes, environmental factors, and their epistasis. Recently, the development of advanced genotyping technologies has allowed us to perform genome-wide association studies (GWASs). For detecting the effects of multiple genes on complex traits, many approaches have been proposed for GWASs. Multifactor dimensionality reduction (MDR) is one of the powerful and efficient methods for detecting high-order gene-gene (GxG) interactions. However, the biological interpretation of GxG interactions identified by MDR analysis is not easy. In order to aid the interpretation of MDR results, we propose a network graph analysis to elucidate the meaning of identified GxG interactions. The proposed network graph analysis consists of three steps. The first step is for performing GxG interaction analysis using MDR analysis. The second step is to draw the network graph using the MDR result. The third step is to provide biological evidence of the identified GxG interaction using external biological databases. The proposed method was applied to Korean Association Resource (KARE) data, containing 8838 individuals with 327,632 single-nucleotide polymorphisms, in order to perform GxG interaction analysis of body mass index (BMI). Our network graph analysis successfully showed that many identified GxG interactions have known biological evidence related to BMI. We expect that our network graph analysis will be helpful to interpret the biological meaning of GxG interactions.
Keywords: gene-gene interaction; generalized multifactor dimensionality reduction; genome-wide association study; graph analysis; graphic processing units; network graph.
Figures
Similar articles
-
Risk score modeling of multiple gene to gene interactions using aggregated-multifactor dimensionality reduction.BioData Min. 2013 Jan 8;6(1):1. doi: 10.1186/1756-0381-6-1. BioData Min. 2013. PMID: 23294634 Free PMC article.
-
A novel method to identify high order gene-gene interactions in genome-wide association studies: gene-based MDR.BMC Bioinformatics. 2012 Jun 11;13 Suppl 9(Suppl 9):S5. doi: 10.1186/1471-2105-13-S9-S5. BMC Bioinformatics. 2012. PMID: 22901090 Free PMC article.
-
A comparative study on the unified model based multifactor dimensionality reduction methods for identifying gene-gene interactions associated with the survival phenotype.BioData Min. 2021 Mar 1;14(1):17. doi: 10.1186/s13040-021-00248-9. BioData Min. 2021. PMID: 33648540 Free PMC article.
-
A unified model based multifactor dimensionality reduction framework for detecting gene-gene interactions.Bioinformatics. 2016 Sep 1;32(17):i605-i610. doi: 10.1093/bioinformatics/btw424. Bioinformatics. 2016. PMID: 27587680
-
Gene-gene interaction: the curse of dimensionality.Ann Transl Med. 2019 Dec;7(24):813. doi: 10.21037/atm.2019.12.87. Ann Transl Med. 2019. PMID: 32042829 Free PMC article. Review.
Cited by
-
What is next after the genes for autoimmunity?BMC Med. 2013 Sep 4;11:197. doi: 10.1186/1741-7015-11-197. BMC Med. 2013. PMID: 24107170 Free PMC article. Review.
-
Differential Associations between CDH13 Genotypes, Adiponectin Levels, and Circulating Levels of Cellular Adhesive Molecules.Mediators Inflamm. 2015;2015:635751. doi: 10.1155/2015/635751. Epub 2015 Oct 27. Mediators Inflamm. 2015. PMID: 26600672 Free PMC article.
-
The association of TGFB1 genetic polymorphisms with high myopia: a systematic review and meta-analysis.Int J Clin Exp Med. 2015 Nov 15;8(11):20355-67. eCollection 2015. Int J Clin Exp Med. 2015. PMID: 26884952 Free PMC article.
-
Epistatic effects of multiple receptor genes on pathophysiology of asthma - its limits and potential for clinical application.Med Sci Monit. 2014 Jan 17;20:64-71. doi: 10.12659/MSM.889754. Med Sci Monit. 2014. PMID: 24435185 Free PMC article. Review.
References
-
- Hirschhorn JN, Daly MJ. Genome-wide association studies for common diseases and complex traits. Nat Rev Genet. 2005;6:95–108. - PubMed
-
- Cho YS, Go MJ, Kim YJ, Heo JY, Oh JH, Ban HJ, et al. A large-scale genome-wide association study of Asian populations uncovers genetic factors influencing eight quantitative traits. Nat Genet. 2009;41:527–534. - PubMed
LinkOut - more resources
Full Text Sources