. 2013 Jan 22:3:204.
doi: 10.3389/fphar.2012.00204. eCollection 2012.

A multi-scale modeling framework for individualized, spatiotemporal prediction of drug effects and toxicological risk

Affiliations

A multi-scale modeling framework for individualized, spatiotemporal prediction of drug effects and toxicological risk

Juan G Diaz Ochoa et al. Front Pharmacol. .

Abstract

In this study, we focus on a novel multi-scale modeling approach for spatiotemporal prediction of the distribution of substances and resulting hepatotoxicity by combining cellular models, a 2D liver model, and whole body model. As a case study, we focused on predicting human hepatotoxicity upon treatment with acetaminophen based on in vitro toxicity data and potential inter-individual variability in gene expression and enzyme activities. By aggregating mechanistic, genome-based in silico cells to a novel 2D liver model and eventually to a whole body model, we predicted pharmacokinetic properties, metabolism, and the onset of hepatotoxicity in an in silico patient. Depending on the concentration of acetaminophen in the liver and the accumulation of toxic metabolites, cell integrity in the liver as a function of space and time as well as changes in the elimination rate of substances were estimated. We show that the variations in elimination rates also influence the distribution of acetaminophen and its metabolites in the whole body. Our results are in agreement with experimental results. What is more, the integrated model also predicted variations in drug toxicity depending on alterations of metabolic enzyme activities. Variations in enzyme activity, in turn, reflect genetic characteristics or diseases of individuals. In conclusion, this framework presents an important basis for efficiently integrating inter-individual variability data into models, paving the way for personalized or stratified predictions of drug toxicity and efficacy.

Keywords: acetaminophen; drug metabolism; hepatotoxicity; pharmacokinetics; toxicity testing.


Figures

Figure 1
Figure 1
Cellular metabolic network model for acetaminophen metabolism and toxicity. Abbreviations: APAP, acetaminophen; APAPG, acetaminophen glucoronide; APAPGS, acetaminophen-glutathione-conjugate; APAPS, acetaminophen sulfate; CYP, cytochrome P450 monooxygenase; GGT, γ-glutamyltransferase; GPX, glutathione peroxidase; GSH, glutathione; GSR, glutathione reductase; GSS, glutathione synthase; GSSG, glutathione disulfide; GST, glutathione S-transferase; MRP (2/3/4), multidrug resistance related protein; NAPQI, N-acetyl-p-benzoquinone imine; NOS, nitric oxide synthase; NQO1, NADPH quinonereductase; SOD, superoxide dismutase; SULT, sulfotransferase; UGT, UDP-glucuronosyltransferase. Index “B,” non-specifically bound (protein/lipid); index “P,” non-specifically bound to protein.
Figure 2
Figure 2
Multi-scale system from single hepatocytes to organ level. Single hepatocytes are coupled to liver capillaries (sinusoids) which are coupled to micro-organelles called lobules. These lobules are considered to be the smallest functional micro-structure in the liver. The corresponding parameters for the lobule module are shown in Table 1.
Figure 3
Figure 3
Representation of one lobule with six sinusoids. Each sinusoid transports blood form a portal triad (PT) to the central vein (CV). We also included lobule zonation.
Figure 4
Figure 4
Scheme of the whole body model. The model is divided into liver, adipose tissue, blood, other well-perfused tissues (WPT), and other poorly perfused tissues (PPT). Blood transporting acetaminophen flows through the in silico liver, consisting of lobules coupled to in silico hepatocytes (containing the metabolic network represented in Figure 1). Acetaminophen is orally administrated and transported from gut to liver. The degradation and metabolization of the substance takes place in the hepatocytes adjacent to and alongside the sinusoids.
Figure 5
Figure 5
Comparison of model simulations with experimental data. Left panel: simulated acetaminophen concentration in plasma (solid lines) compared within vivo pharmacokinetics: (1) single dose of 1000 mg (Rawlins et al., 1977), (2) single dose of 2000 mg (Rawlins et al., 1977), (3) single dose of 2000 mg (Brunner et al., 2002), (4) single dose of 5475 mg (Douglas et al., 1996), and (5) single dose of 5475 mg (Ly et al., 2004). Right panel: comparison of model simulation (solid line) with estimated concentration of acetaminophen in the liver using a PBPK model (Péry et al., 2012) after administration of a single dose of 500 mg/kg.
Figure 6
Figure 6
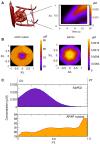
Spatial distribution of acetaminophen (APAP) and NAPQI. (A) Spatial distribution of APAP in the sinusoid after 10 min for a single dose of 393 mg/kg. The distribution of NAPQI is schematically given as a function of the distance (sinusoidal length normalized as x/L) and time. (B) Distribution of cellular APAP and NAPQI in the lobule at 4 h after a single APAP dose (393 mg/kg). (C) Mean distribution of NAPQI and cellular APAP in the lobule as a function of the sinusoidal length.
Figure 7
Figure 7
Substance concentrations and mean viability in the lobule (see Figure 8) estimated using the multi-scale model. Time courses are shown for the concentration of APAP in plasma, concentration of H2O2 in the cell (measured at the central vein, according to Figure 3), and total cell viability in the lobule for a dose of 310, 450, and 470 mg/kg, respectively. For viability estimation, it was assumed that an increase in H2O2 concentration above a critical threshold results in necrotic death of the respective cell.
Figure 8
Figure 8
Cell viability in the lobule at different time points for two different CYP3A4 activities after a single oral APAP dose of 393 mg/kg. Viable cells are schematically illustrated n orange, dead cells in black. The spatial distribution corresponds to the detailed scheme and coordinates given in Figure 3. CYP activities in μM/min, time in min.
Figure 9
Figure 9
Viability as a function of the oral APAP dose (left) and as a function of the APAP concentration in blood plasma at 33 h after APAP dose (right). Range of possible toxic daily APAP concentrations as reported in literature is given by the black dotted lines (see, e.g., the guideline suggested by Dart et al., 2006).
Figure 10
Figure 10
Response upon oral APAP dose of 393 mg/kg depending on variations in the activity of CYP3A4 and CYP2E1. Simulated concentrations of APAP in serum and of H2O2in cells at the central vein in the lobule are shown. The viability is the mean value of the whole lobule. The left group of panels corresponds to a CYP2E1 activity of 1 μmol/Lcell/min, the right group of panels to a CYP2E1 activity of 5 μmol/Lcell/min. Additionally, a comparison between two CYP3A4 activities, 0.95 and 1.9 μmol/Lcell/min, is given in each figure.

Similar articles

Cited by

References

    1. Adjei A. A., Gaedigk A., Simon S. D., Weinshilboum R. M., Leeder J. S. (2008). Interindividual variability in acetaminophen sulfation by human fetal liver: implications for pharmacogenetic investigations of drug-induced birth defects. Birth Defects Res. Part A Clin. Mol. Teratol. 82, 155–16510.1002/bdra.20535 - DOI - PubMed
    1. Allen J. W., Khetani S. R., Bhatia S. N. (2004). In vitro zonation and toxicity in a hepatocyte bioreactor. Toxicol. Sci. 84, 110–11910.1093/toxsci/kfi052 - DOI - PubMed
    1. Allen J. W., Khetani S. R., Bhatia S. N. (2005). in vitro zonation and toxicity in a hepatocyte bioreactor. Toxicol. Sci. 84, 110–11910.1093/toxsci/kfi052 - DOI - PubMed
    1. Arias I. M., Alter H. J., Boyer J. L., Cohen D. E., Fausto N., Shaftitz D. A., et al. (2009). The Liver: Biology and Pathobiology. Australia: John Wiley and Sons
    1. Basketter D. A., Clewell H., Kimber I., Rossi A., Blaauboer B., Burrier R., et al. (2012). A roadmap for the development of alternative (non-animal) methods for systemic toxicity testing – t4 report*. ALTEX 29, 3–91 - PubMed