

Analysis of composition and structure of coastal to mesopelagic bacterioplankton communities in the northern gulf of Mexico
- PMID: 23346078
- PMCID: PMC3548560
- DOI: 10.3389/fmicb.2012.00438
Analysis of composition and structure of coastal to mesopelagic bacterioplankton communities in the northern gulf of Mexico
Abstract
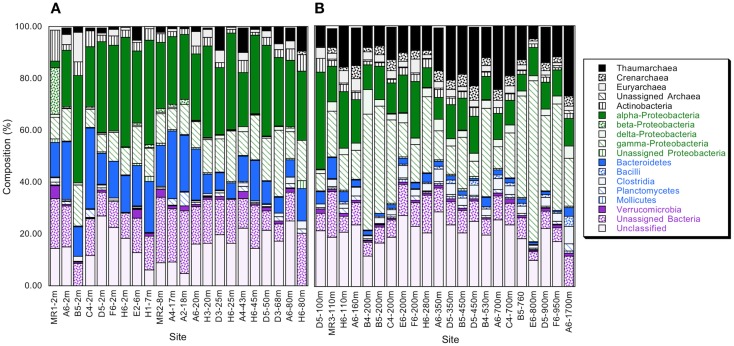
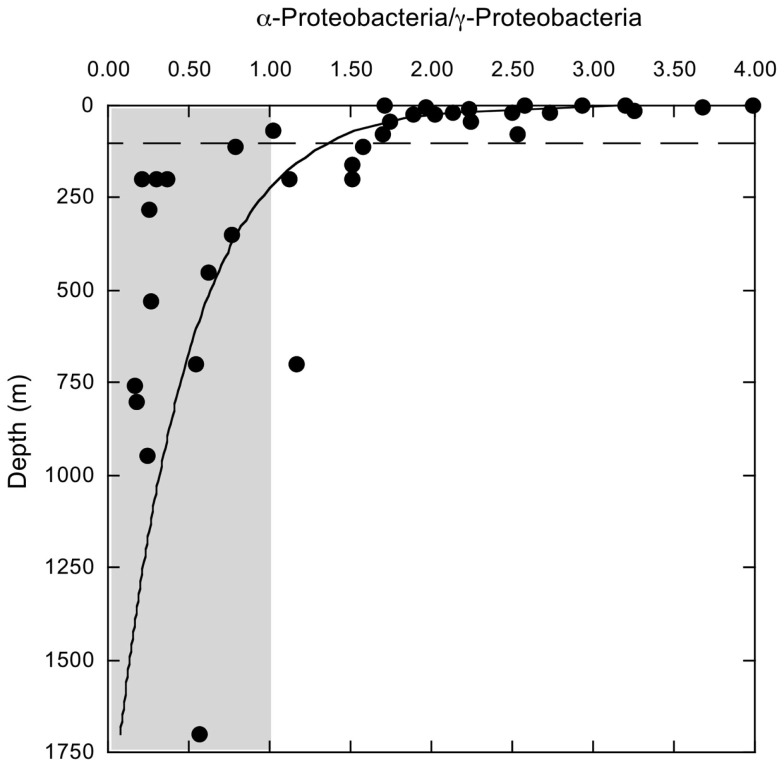
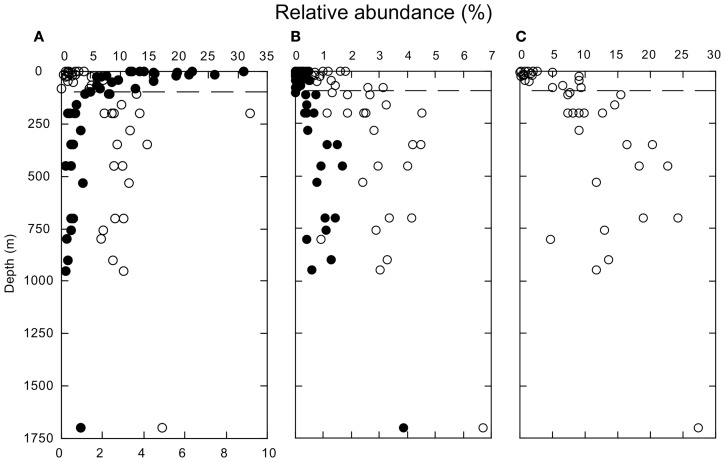
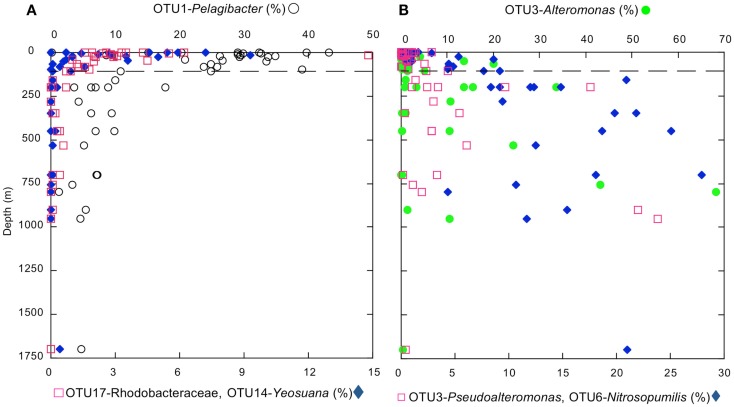
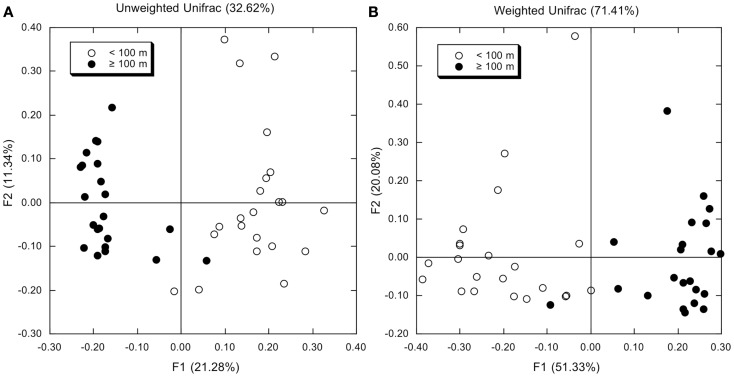
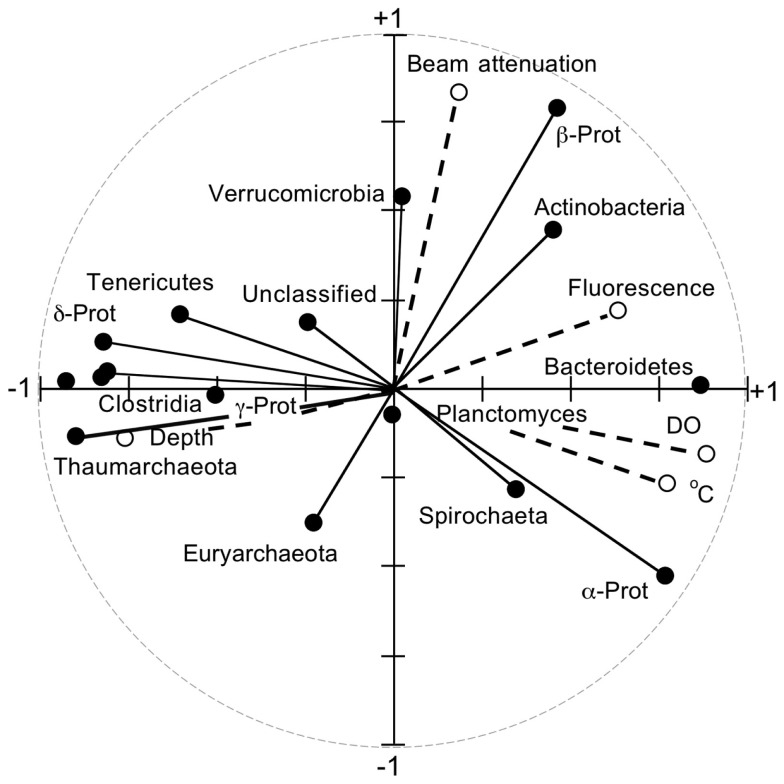
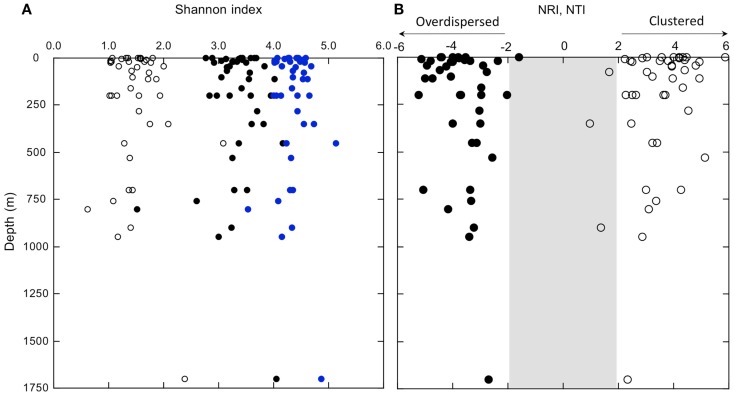
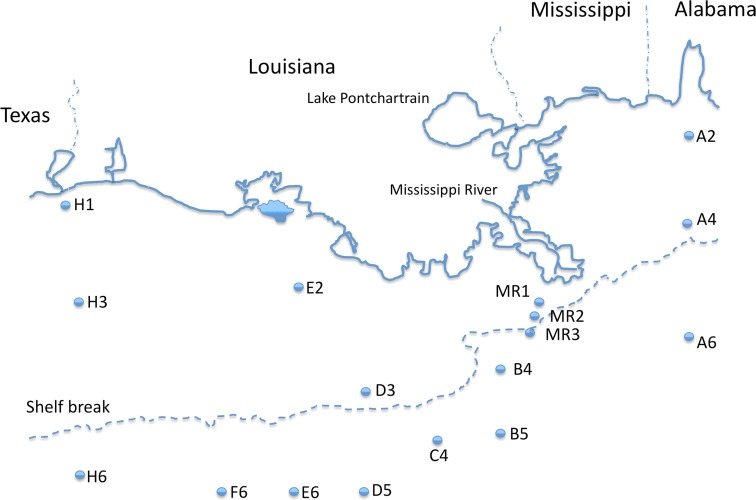
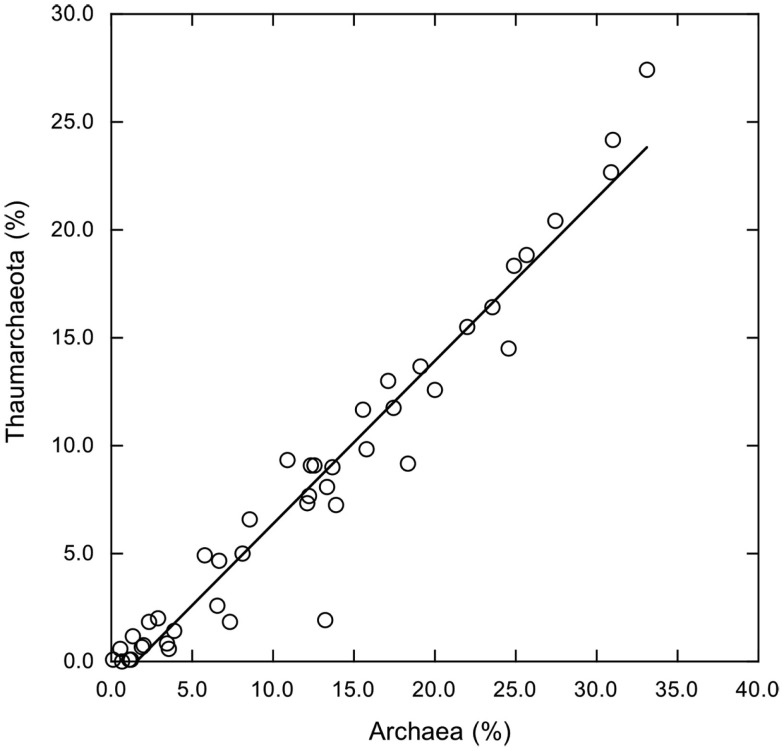
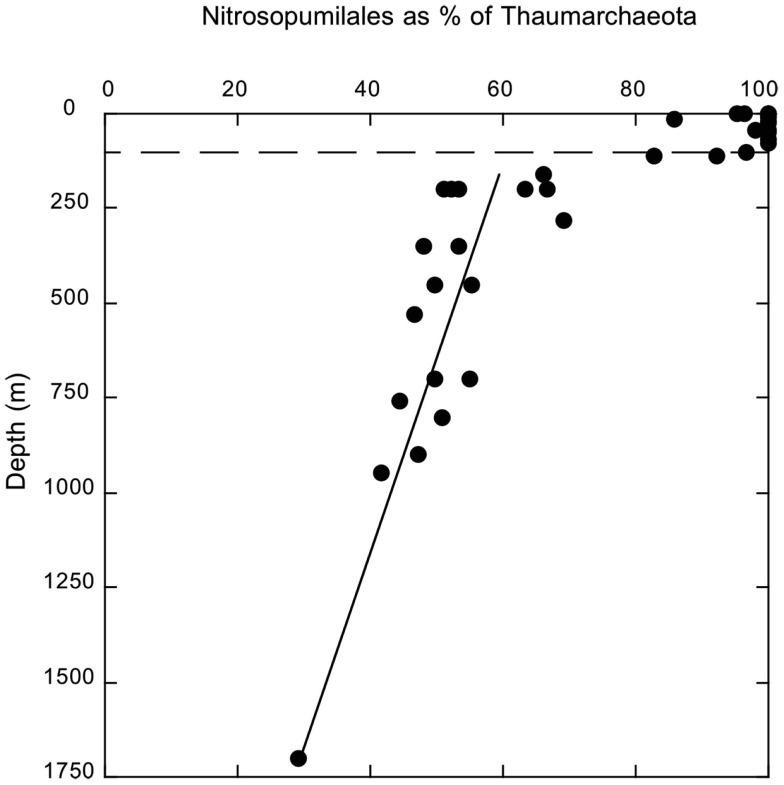
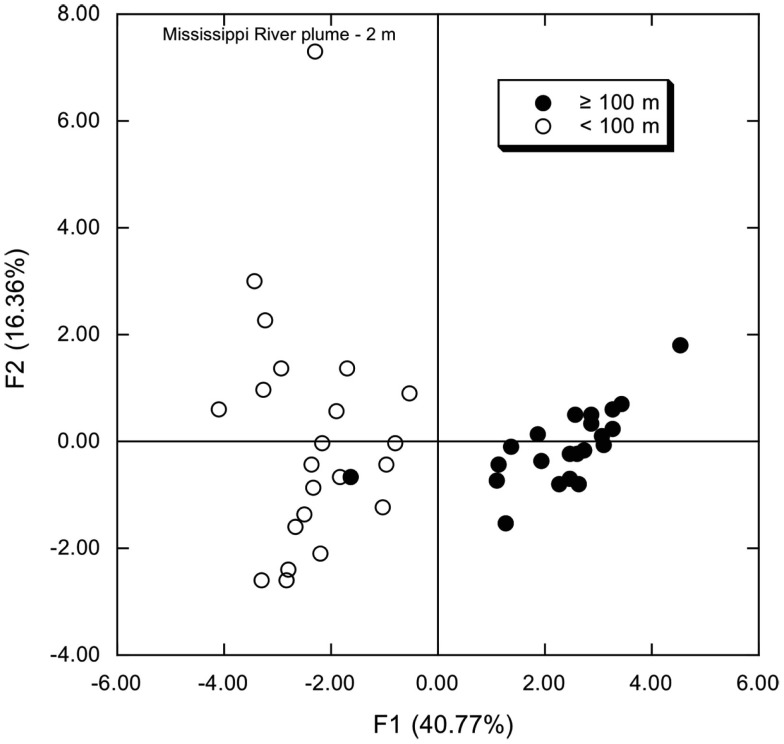
16S rRNA gene amplicons were pyrosequenced to assess bacterioplankton community composition, diversity, and phylogenetic community structure for 17 stations in the northern Gulf of Mexico (nGoM) sampled in March 2010. Statistical analyses showed that samples from depths ≤100 m differed distinctly from deeper samples. SAR 11 α-Proteobacteria and Bacteroidetes dominated communities at depths ≤100 m, which were characterized by high α-Proteobacteria/γ-Proteobacteria ratios (α/γ > 1.7). Thaumarchaeota, Firmicutes, and δ-Proteobacteria were relatively abundant in deeper waters, and α/γ ratios were low (<1). Canonical correlation analysis indicated that δ- and γ-Proteobacteria, Thaumarchaeota, and Firmicutes correlated positively with depth; α-Proteobacteria and Bacteroidetes correlated positively with temperature and dissolved oxygen; Actinobacteria, β-Proteobacteria, and Verrucomicrobia correlated positively with a measure of suspended particles. Diversity indices did not vary with depth or other factors, which indicated that richness and evenness elements of bacterioplankton communities might develop independently of nGoM physical-chemical variables. Phylogenetic community structure as measured by the net relatedness (NRI) and nearest taxon (NTI) indices also did not vary with depth. NRI values indicated that most of the communities were comprised of OTUs more distantly related to each other in whole community comparisons than expected by chance. NTI values derived from phylogenetic distances of the closest neighbor for each OTU in a given community indicated that OTUs tended to occur in clusters to a greater extent than expected by chance. This indicates that "habitat filtering" might play an important role in nGoM bacterioplankton species assembly, and that such filtering occurs throughout the water column.
Keywords: bacterioplankton; diversity; northern Gulf of Mexico; phylogenetic community structure; thaumarchaeota.
Figures

Similar articles
-
Alkane hydroxylase gene (alkB) phylotype composition and diversity in northern Gulf of Mexico bacterioplankton.Front Microbiol. 2013 Dec 12;4:370. doi: 10.3389/fmicb.2013.00370. eCollection 2013. Front Microbiol. 2013. PMID: 24376439 Free PMC article.
-
Mississippi River Plume Enriches Microbial Diversity in the Northern Gulf of Mexico.Front Microbiol. 2016 Jul 7;7:1048. doi: 10.3389/fmicb.2016.01048. eCollection 2016. Front Microbiol. 2016. PMID: 27458442 Free PMC article.
-
Distribution, Community Composition, and Potential Metabolic Activity of Bacterioplankton in an Urbanized Mediterranean Sea Coastal Zone.Appl Environ Microbiol. 2017 Aug 17;83(17):e00494-17. doi: 10.1128/AEM.00494-17. Print 2017 Sep 1. Appl Environ Microbiol. 2017. PMID: 28667110 Free PMC article.
-
Investigating monsoon and post-monsoon variabilities of bacterioplankton communities in a mangrove ecosystem.Environ Sci Pollut Res Int. 2018 Feb;25(6):5722-5739. doi: 10.1007/s11356-017-0852-y. Epub 2017 Dec 11. Environ Sci Pollut Res Int. 2018. PMID: 29230649
-
Distinct Seasonal Patterns of Bacterioplankton Abundance and Dominance of Phyla α-Proteobacteria and Cyanobacteria in Qinhuangdao Coastal Waters Off the Bohai Sea.Front Microbiol. 2017 Aug 18;8:1579. doi: 10.3389/fmicb.2017.01579. eCollection 2017. Front Microbiol. 2017. PMID: 28868051 Free PMC article.
Cited by
-
Challenging Oil Bioremediation at Deep-Sea Hydrostatic Pressure.Front Microbiol. 2016 Aug 3;7:1203. doi: 10.3389/fmicb.2016.01203. eCollection 2016. Front Microbiol. 2016. PMID: 27536290 Free PMC article. Review.
-
Microbiomes of the Enteropneust, Saccoglossus bromophenolosus, and Associated Marine Intertidal Sediments of Cod Cove, Maine.Front Microbiol. 2018 Dec 14;9:3066. doi: 10.3389/fmicb.2018.03066. eCollection 2018. Front Microbiol. 2018. PMID: 30631312 Free PMC article.
-
Metabolic and spatio-taxonomic response of uncultivated seafloor bacteria following the Deepwater Horizon oil spill.ISME J. 2017 Nov;11(11):2569-2583. doi: 10.1038/ismej.2017.110. Epub 2017 Aug 4. ISME J. 2017. PMID: 28777379 Free PMC article.
-
Microbial Community Composition, Functions, and Activities in the Gulf of Mexico 1 Year after the Deepwater Horizon Accident.Appl Environ Microbiol. 2015 Sep 1;81(17):5855-66. doi: 10.1128/AEM.01470-15. Epub 2015 Jun 19. Appl Environ Microbiol. 2015. PMID: 26092461 Free PMC article.
-
Structure and composition of microbial communities in the water column from Southern Gulf of Mexico and detection of putative hydrocarbon-degrading microorganisms.Environ Microbiol Rep. 2024 Jun;16(3):e13264. doi: 10.1111/1758-2229.13264. Environ Microbiol Rep. 2024. PMID: 38692840 Free PMC article.
References
-
- Barberán A., Casamayor E. O. (2010). Global phylogenetic community structure and β-diversity patterns in surface bacterioplankton metacommunities. Aquat. Microb. Ecol. 59, 1–1010.3354/ame01389 - DOI
LinkOut - more resources
Full Text Sources
Other Literature Sources
Miscellaneous