. 2012:2012:271606.
doi: 10.1155/2012/271606. Epub 2012 Dec 31.

Beneficial effect of shikonin on experimental colitis induced by dextran sulfate sodium in BALB/c mice

Affiliations

Beneficial effect of shikonin on experimental colitis induced by dextran sulfate sodium in BALB/c mice

Isabel Andújar et al. Evid Based Complement Alternat Med. 2012.

Abstract

The naphthoquinone shikonin, a major component of the root of Lithospermum erythrorhizon, now is studied as an anti-inflammatory agent in the treatment of ulcerative colitis (UC). Acute UC was induced in Balb/C mice by oral administration of 5% dextran sodium sulfate (DSS). The disease activity index was evaluated, and a histologic study was carried out. Orally administered shikonin reduces induced UC in a dose-dependent manner, preventing the shortening of the colorectum and decreasing weight loss by 5% while improving the appearance of feces and preventing bloody stools. The disease activity index score was much lower in shikonin-treated mice than in the colitic group, as well as the myeloperoxidase activity. The expression of cyclooxygenase-2 was reduced by 75%, activation of NF-κB was reduced by 44%, and that of pSTAT-3 by 47%, as well as TNF-α, IL-1β, and IL-6 production. Similar results were obtained in primary macrophages culture. This is the first report of shikonin's ability to attenuate acute UC induced by DSS. Shikonin acts by blocking the activation of two major targets: NF-κB and STAT-3, and thus constitutes a promising potential therapeutic agent for the management of the inflammatory bowel disease.


Figures

Figure 1
Figure 1
Chemical structure of shikonin.
Figure 2
Figure 2
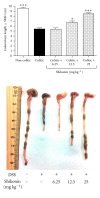
Effect of shikonin on colon length. The noncolitic group received fresh tap water ad libitum, and the colitic group received fresh tap water with 5% DSS added to the water during 7 days. Three other groups of mice received the same tap water with 5% DSS and were treated with two doses of 6.25, 12.5, or 25 mg kg−1 of shikonin on days 1 and 5 of the experiment. At the end of the experiment, all mice were killed by cervical dislocation and large intestines were removed. After washing with ice-cold phosphate-buffered saline, they were placed on filter papers and measured without the cecum. Statistical analysis was performed using one-way analysis of variance followed by Dunnett's t-test. *P < 0.05, ***P < 0.001 versus colitic group. The results shown are representative of three independent experiments with 6 to 10 mice per group.
Figure 3
Figure 3
Effect of shikonin on the disease activity index. Disease activity index was evaluated for colitic groups (black bars) and shikonin-treated colitic groups on termination of the experiment according to the scoring on Table 1. ***Significantly different from the colitic group (P < 0.001; one-way analysis of variance followed by Dunnett's t-test).
Figure 4
Figure 4
Effect of shikonin treatment on histological parameters in acute ulcerative colitis. Three representative colonic haematoxylin/eosin sections: mice received either fresh tap water (a), fresh tap water with 5% DSS (b), or fresh tap water with DSS 5% and treatment with shikonin 25 mg kg−1 (c) as described in Section 2. Inflammatory infiltrate (arrow); replenishment of goblet cells with mucin (star). (d) The severity of inflammation (white bars), extent of inflammation (dotted bars), and crypt damage (lined bars) were determined as described in Table 2. The data presented are representative of three independent experiments with 6 to 10 mice per group. The boundary of the box indicates the 25th and 75th percentiles; the line within the box marks the median. Whiskers indicate the 90th and 10th percentile. **Significantly different from the total histological score of the colitic group, determined by means of a one-way analysis of variance followed by Dunnett's t-test (P < 0.01). (e) Mucosal myeloperoxidase levels were measured to evaluate the effect of shikonin on the number of neutrophils infiltrating the colon. *P < 0.05, **P < 0.01; significantly different from the colitic group; # P < 0.05, ## P < 0.01; significantly different from the noncolitic group, determined by means of a one-way analysis of variance followed by Dunnett's t-test (n = 6).
Figure 5
Figure 5
Immunofluorescence detection of CD4+ lymphocytes and CD11b+ cells. Shikonin treatment reduces the presence of CD4+ lymphocytes and macrophages in the colon tissue of mice. Colons were obtained from the colitic group and from the shikonin-(25 mg kg−1) treated group and were processed for immunofluorescence analysis using CD4+ FITC-conjugated monoclonal antibody and CD11b+ APC-conjugated monoclonal antibody; representative results from four independent animals are shown. Arrows indicate the positive stained cells. Original magnification, 200×.
Figure 6
Figure 6
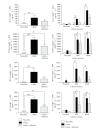
Expression of cytokines in the supernatant of colonic culture by ELISA. Colons were cultured for 24 h, supernatants were collected, and cytokines were measured in duplicate with ELISA. Left panels represent the levels of cytokines measured in the whole colon (after removing cecum and anus); right panels represent the levels of cytokines measured in the different areas of the colon (proximal, mid, and distal area). Results are expressed as the concentration of cytokine referred to wet weight (pg mL−1 mg−1) ±SEM and are representative of three independent experiments with 2 colons per group. Differences with the colitic group were determined by means of a one-way analysis of variance followed by Dunnett's t-test (*P < 0.05, **P < 0.01; significantly different from the colitic group; # P < 0.05, ## P < 0.01; significantly different from the noncolitic group).
Figure 7
Figure 7
Effect of shikonin on nitric oxide and overall cytokine production in peritoneal macrophages isolated from Balb/C mice. Mouse peritoneal macrophages were isolated and cultured for 24 h. Supernatants were collected, and nitrites and cytokines were measured in duplicate. The B (blank) group represents untreated and unstimulated macrophages, C (control) group represents those macrophages stimulated with lipopolysaccharide (1 μg mL−1), and finally two other groups were treated for 1 h with different doses of shikonin (0.5 and 1 μM) prior to stimulation with lipopolysaccharide. Results are representative of ten independent experiments. Differences were determined by means of a one-way analysis of variance followed by Dunnett's t-test (*P < 0.05, **P < 0.01, ***P < 0.001 significantly different from the control group; ## P < 0.01, significantly different from the blank group).
Figure 8
Figure 8
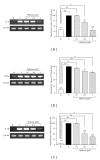
Expression of proinflammatory genes in peritoneal macrophages isolated from Balb/C mice. Proinflammatory gene expression levels were measured using RT-PCR, as described in Section 2. Representative photographs from ten independent experiments with each gene are shown. β-Actin served as the internal control. The expression seen in the lipopolysaccharide-stimulated group (control) was standardized as 100% expression. *P < 0.05, **P < 0.01; significantly different from the control group; # P < 0.05, ## P < 0.01; significantly different from the blank (unstimulated) group, determined by means of a one-way analysis of variance followed by Dunnett's t-test (n = 10).
Figure 9
Figure 9
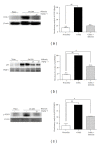
Effects of shikonin on cyclooxygenase-2 expression and on nuclear translocation of p65 and phosphorylated signal transducer and activator of transcription 3. The left panels show an example of western blot following probing with the corresponding antibody. The histograms at the right represent the data derived from the western blots following densitometry analysis. Levels were normalized against β-actin or PARP-1 antibody. **P < 0.01 significantly different from the colitic group; # P < 0.05, ## P < 0.01 significantly different from the noncolitic group, determined by means of a one-way analysis of variance followed by Dunnett's t-test (n = 6–10).
Figure 10
Figure 10
Induction of acute ulcerative colitis and treatment protocol.

References

    1. Kornbluth A, Sachar DB. Ulcerative colitis practice guidelines in adults: American college of gastroenterology, practice parameters committee. American Journal of Gastroenterology. 2010;105(3):501–523. - PubMed
    1. Stange EF, Travis SPL, Vermeire S, et al. European evidence-based Consensus on the diagnosis and management of ulcerative colitis: definitions and diagnosis. Journal of Crohn’s and Colitis. 2008;2(1):1–23. - PubMed
    1. Ghosh S, Mitchell R. Impact of inflammatory bowel disease on quality of life: results of the European Federation of Crohn’s and Ulcerative Colitis Associations (EFCCA) patient survey. Journal of Crohn’s and Colitis. 2007;1(1):10–20. - PubMed
    1. Lakatos PL. Recent trends in the epidemiology of inflammatory bowel diseases: up or down? World Journal of Gastroenterology. 2006;12(38):6102–6108. - PMC - PubMed
    1. Bonen DK, Cho JH. The genetics of inflammatory bowel disease. Gastroenterology. 2003;124(2):521–536. - PubMed