

The use of biomonitoring data in exposure and human health risk assessment: benzene case study
- PMID: 23346981
- PMCID: PMC3585443
- DOI: 10.3109/10408444.2012.756455
The use of biomonitoring data in exposure and human health risk assessment: benzene case study
Abstract
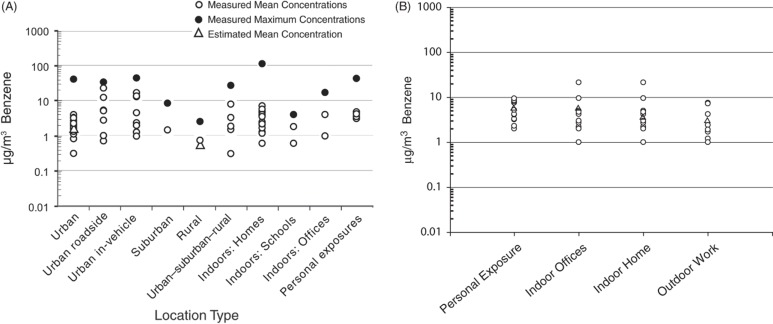
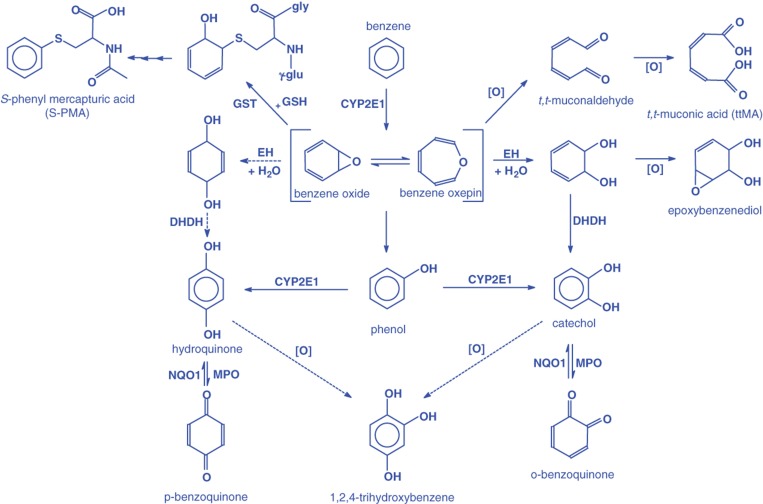
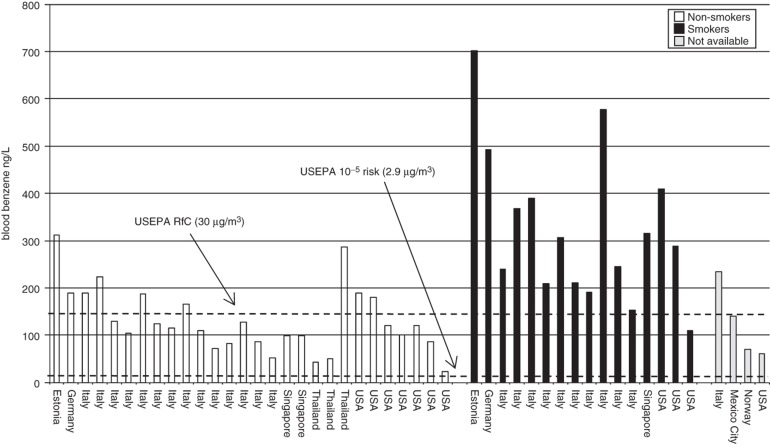
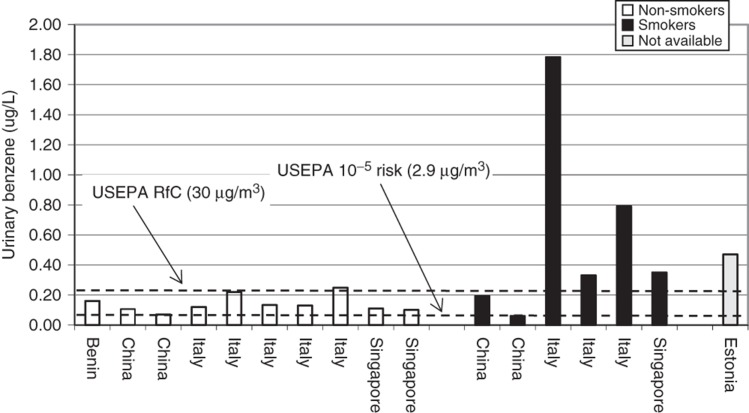
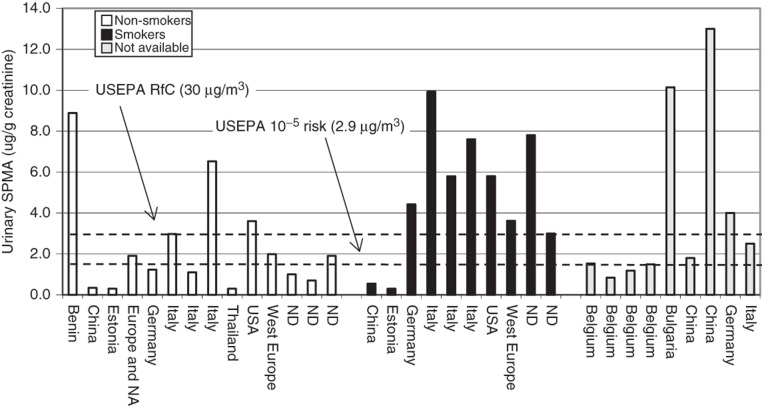
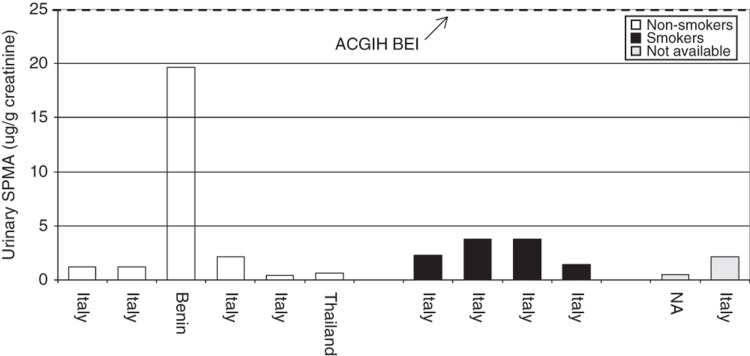
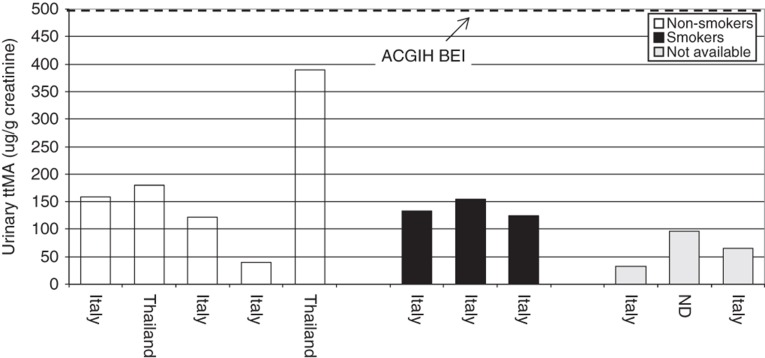
Abstract A framework of "Common Criteria" (i.e. a series of questions) has been developed to inform the use and evaluation of biomonitoring data in the context of human exposure and risk assessment. The data-rich chemical benzene was selected for use in a case study to assess whether refinement of the Common Criteria framework was necessary, and to gain additional perspective on approaches for integrating biomonitoring data into a risk-based context. The available data for benzene satisfied most of the Common Criteria and allowed for a risk-based evaluation of the benzene biomonitoring data. In general, biomarker (blood benzene, urinary benzene and urinary S-phenylmercapturic acid) central tendency (i.e. mean, median and geometric mean) concentrations for non-smokers are at or below the predicted blood or urine concentrations that would correspond to exposure at the US Environmental Protection Agency reference concentration (30 µg/m(3)), but greater than blood or urine concentrations relating to the air concentration at the 1 × 10(-5) excess cancer risk (2.9 µg/m(3)). Smokers clearly have higher levels of benzene exposure, and biomarker levels of benzene for non-smokers are generally consistent with ambient air monitoring results. While some biomarkers of benzene are specific indicators of exposure, the interpretation of benzene biomonitoring levels in a health-risk context are complicated by issues associated with short half-lives and gaps in knowledge regarding the relationship between the biomarkers and subsequent toxic effects.
Figures
References
-
- ACGIH. Benzene: BEI® documentation. 7th. Cincinnati, OH: American Conference of Governmental Industrial Hygienist; 2001.
-
- ACGIH. Threshold limit values (TLVs) and biological exposure indices (BEIs) Cincinnati, OH: American Conference of Governmental Industrial Hygienist; 2007.
-
- Ahmad Khan H. Benzene’s toxicity: a consolidated short review of human and animal studies. Hum Exp Toxicol. 2007;26:677–85. - PubMed
Publication types
MeSH terms
Substances
LinkOut - more resources
Full Text Sources
Other Literature Sources