. 2013 Jan 24:14:4.
doi: 10.1186/1471-2172-14-4.

Effects of HIV-1-induced CD1c and CD1d modulation and endogenous lipid presentation on CD1c-restricted T-cell activation

Affiliations

Effects of HIV-1-induced CD1c and CD1d modulation and endogenous lipid presentation on CD1c-restricted T-cell activation

Halonna Kelly et al. BMC Immunol. .

Abstract

Background: It has been shown that human immunodeficiency virus (HIV)-1 infection induces the production of endogenous lipids required for effective viral production, and the cluster of differentiation (CD)1 molecule CD1d is downregulated by HIV-1 infection. However, the role of endogenous lipid presentation and the implications of CD1 downregulation by HIV-1 infection have not yet been characterized.

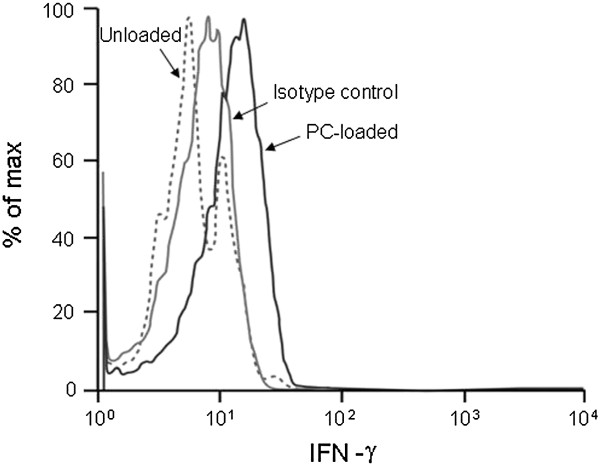
Results: In this study, we observed downregulation of both CD1c and CD1d expression through a Vpu-dependent and Nef-independent mechanism, and the concomitant HIV-1-induced production of host cholesterol decreased the extent of CD1c and CD1d modulation. While the modest downregulation of CD1c by HIV-1 infection decreased the ability of CD1c-restricted T cells to respond and secrete interferon-γ, the cholesterol upregulation in the same cells by HIV-1 infection appears to limit the downregulation of CD1c.

Conclusions: The two conflicting HIV-1-mediated changes in CD1c expression appear to minimize the modulation of CD1c expression, thus leading the host to maintain a CD1c-restricted T-cell response against HIV-1.


Figures

Figure 1
Figure 1
CD1c-restricted T cells are reactive against the endogenous lipid phosphatidylcholine. HeLa cells were transfected with CD1c and CD1d constructs and used as antigen presenting cells. The HeLa-CD1 cells were loaded with 50 μg/ml phosphatidylcholine (PC) and used to stimulate CD1c-restricted T cells for 24 hours. Supernatants were collected and used in an IFN-γ ELISA. Data represent results from one of three independent experiments.
Figure 2
Figure 2
Increased cholesterol production does not alter CD1c/CD1d expression, but induces IFN-γ in CD1c-restricted T cells. (A) Jurkat cells were cultured in the presence of varying amounts of mevalonate, a precursor and inducer of cholesterol. CD1c and CD1d expression was assessed 10 days later via FACS. Data were averaged from three independent experiments. (B) Jurkat cells were either untreated or cultured with 200 μM mevalonate for 10 days and then used to stimulate CD1c-restricted T cells for 24 hours. Supernatants were collected and analyzed by IFN-γ ELISA. Standard deviation bars are averaged from three separate experiments.
Figure 3
Figure 3
Effects of HIV-1 on CD1c/CD1d expression.(A) HIV-1 infection modulates CD1c/CD1d expression. Jurkat cells were mock or HIV-1 IIIb infected for 10 days, and the levels of CD1c and CD1d expression were measured by FACS. CD1c/CD1d expression was normalized using uninfected, treated controls and plotted as % modulation from the controls. (B) Blocking cholesterol production results in significant CD1c/CD1d downregulation during HIV-1 infection. Jurkat cells were either treated with simvastatin, an inhibitor of cholesterol synthesis, or infected with HIV IIIb and cultured for 5 days. The levels of CD1c and CD1d expression were assessed by FACS, and data were normalized using uninfected, treated controls and plotted as % modulation from controls. All data represent results from one of three independent experiments.
Figure 4
Figure 4
Vpu, but not Nef, plays a role in CD1c/CD1d modulation. Jurkat cells were infected with wild-type (WT), delta Vpu (ΔVpu), or delta Nef (ΔNef) NL4-3 viruses for 2 days (A) or 10 days (B). The expression levels of CD1c and CD1d were then determioned by FACS and expressed as Mean Fluorescence Intensity (MFI). Data represent results from one of three independent experiments. (C) HIV-1 RNA copy number at each time point (2 days and 10 days post-infection) was determined by qPCR. HIV-1 RNA copy number was normalized based on the copy number of GAPDH. Data represent results from one of three independent experiments.
Figure 5
Figure 5
Vpu-dependent CD1c and CD1d down-modulation. Jurkat cells were transfected with full-length HIV (WT) or Vpu-only (vpu) expressing vectors and CD1c and CD1d expression was checked after 24 hours of transfection. Results correspond to the level of CD1c and CD1d expression (MFI) of untransfected and transfected cells as determined by FACS.
Figure 6
Figure 6
HIV-1 infected cells have decreased capacity to induce IFN-γ secretion by CD1c-restricted T cells. (A) Jurkat cells were either mock or HIV-1 IIIb infected with or without 10 μM simvastatin for 10 days. The cells were then used to stimulate CD1c-restricted T cells for 24 hours. Supernatants were collected and subjected to IFN-γ ELISA. (B) HIV-infected cells were cultured with or without CD1c-restricted T cells overnight, and p24 was subsequently measured in supernatants. These data represent results from one of three independent experiments.
Figure 7
Figure 7
HIV modulates CD1c/CD1d expression on primary cells. Peripheral blood mononuclear cells (PBMCs) from healthy donors were isolated, activated with phytohaemagglutinin (PHA), and mock or HIV-1 IIIb infected for 10 days. The expression levels of CD1c and CD1d were measured by FACS. The levels of CD1c/CD1d expression were normalized using uninfected, treated controls and plotted as % modulation from controls. Data represent results from one of three independent experiments.
Figure 8
Figure 8
Endogenous lipid reactive T cells circulate at low levels in the periphery. Naïve T cells were stimulated with PC-loaded HeLa-CD1c cells overnight. After gating the CD8+ population, intracellular IFN-γ was assessed by FACS. A solid black line, a solid grey line, and a dashed line indicate PC-loaded, isotype control, and unloaded, respectively. Data represent results from one of three independent experiments.

Similar articles

Cited by

References

    1. Brigl M, Brenner MB. CD1: antigen presentation and T cell function. Annu Rev Immuno. 2004;22:817–890. doi: 10.1146/annurev.immunol.22.012703.104608. - DOI - PubMed
    1. Moody DB, Zajonc DM, Wilson IA. Anatomy of CD1-lipid antigen complexes. Nat Rev Immunol. 2005;5(5):387–399. doi: 10.1038/nri1605. - DOI - PubMed
    1. Tsuji M. Glycolipids and phospholipids as natural CD1d-binding NKT cell ligands. Cell Mol Life Sci. 2006;63(16):1889–1898. doi: 10.1007/s00018-006-6073-z. - DOI - PMC - PubMed
    1. Brigl M, Bry L, Kent SC, Gumperz JE, Brenner MB. Mechanism of CD1d-restricted natural killer T cell activation during microbial infection. Nat Immunol. 2003;4(12):1230–1237. doi: 10.1038/ni1002. - DOI - PubMed
    1. De Libero G, Moran AP, Gober HJ, Rossy E, Shamshiev A, Chelnokova O, Mazorra Z, Vendetti S, Sacchi A, Prendergast MM. et al.Bacterial infections promote T cell recognition of self-glycolipids. Immunity. 2005;22(6):763–772. doi: 10.1016/j.immuni.2005.04.013. - DOI - PubMed

Publication types

MeSH terms

LinkOut - more resources