. 2013 Aug 1;521(11):2416-38.
doi: 10.1002/cne.23305.

Mapping kainate activation of inner neurons in the rat retina

Affiliations

Mapping kainate activation of inner neurons in the rat retina

Lisa Nivison-Smith et al. J Comp Neurol. .

Abstract

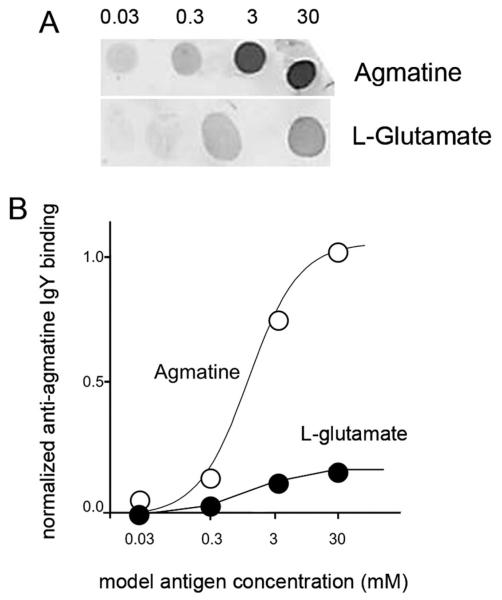
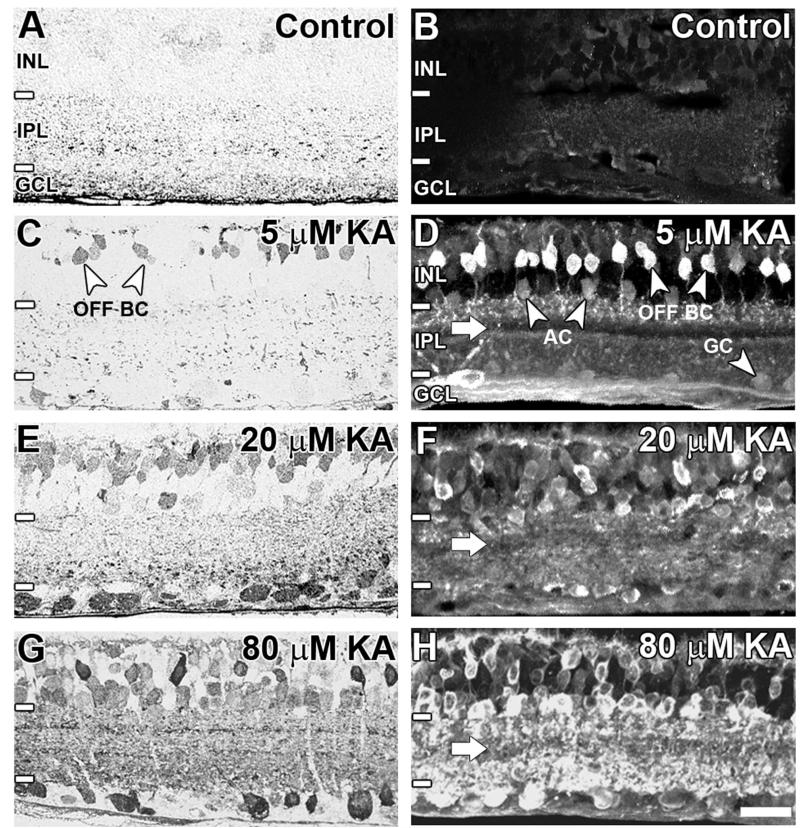
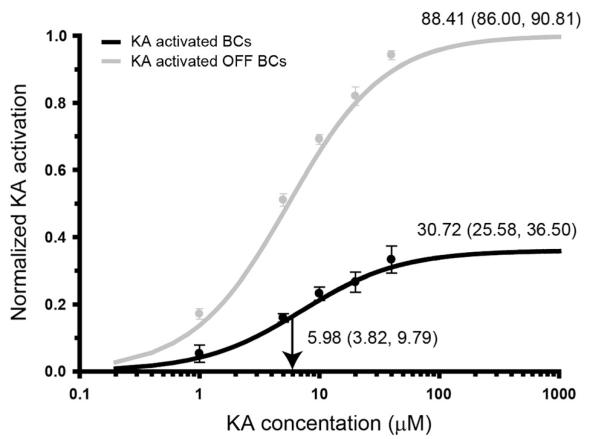
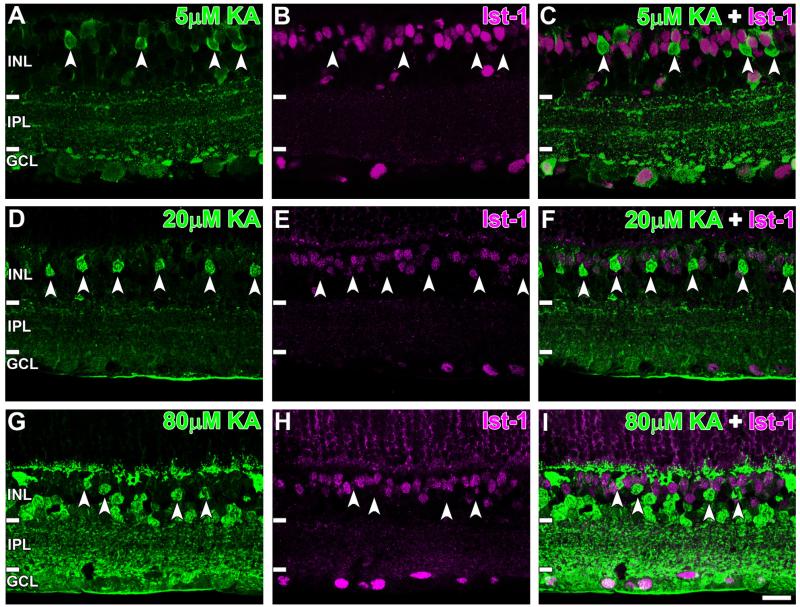
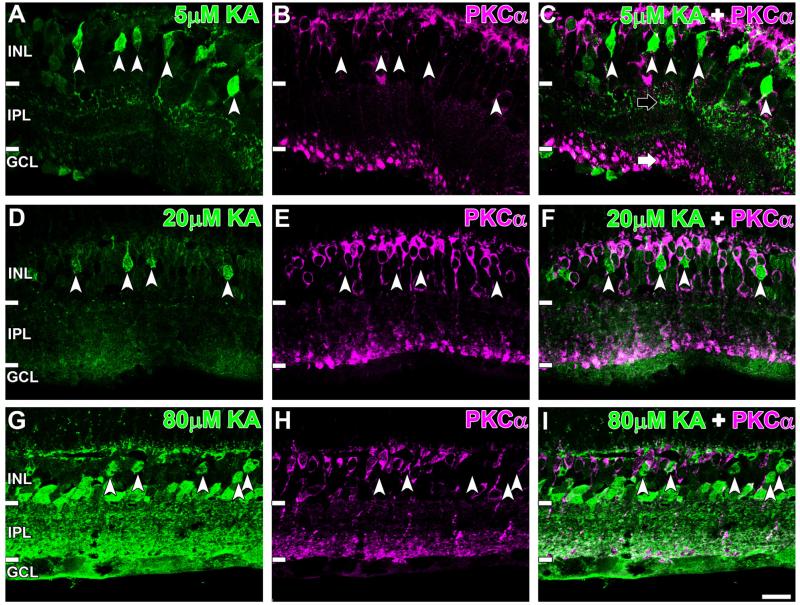
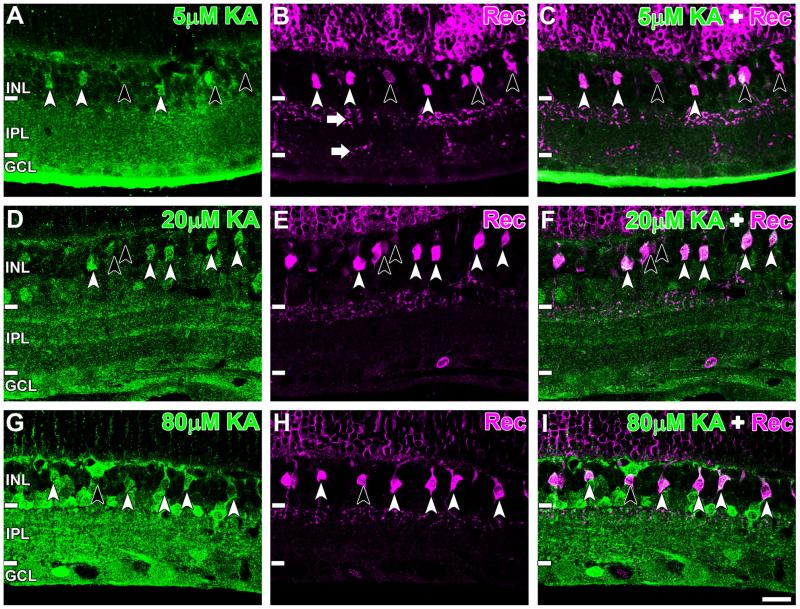
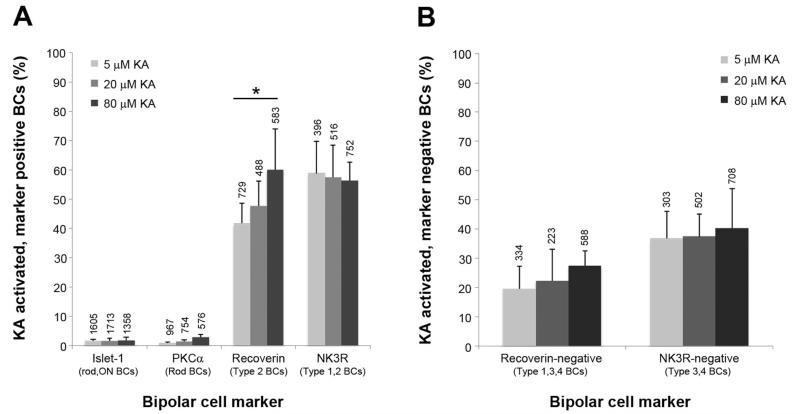
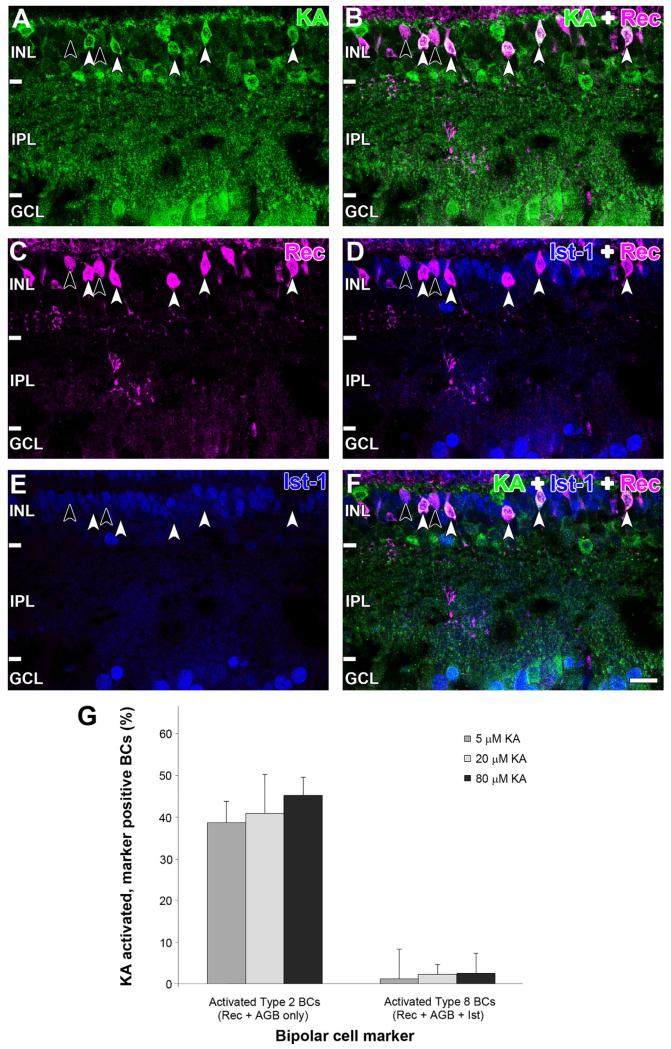
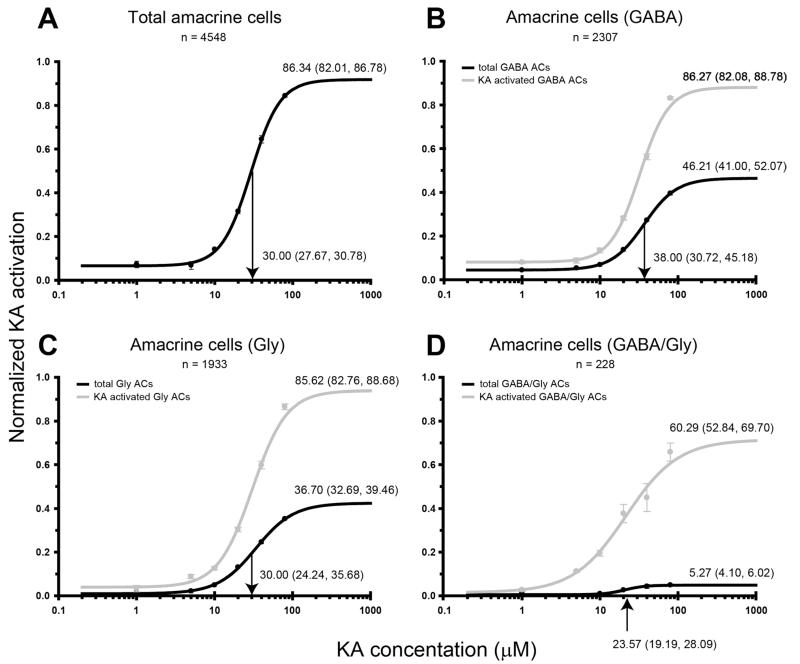
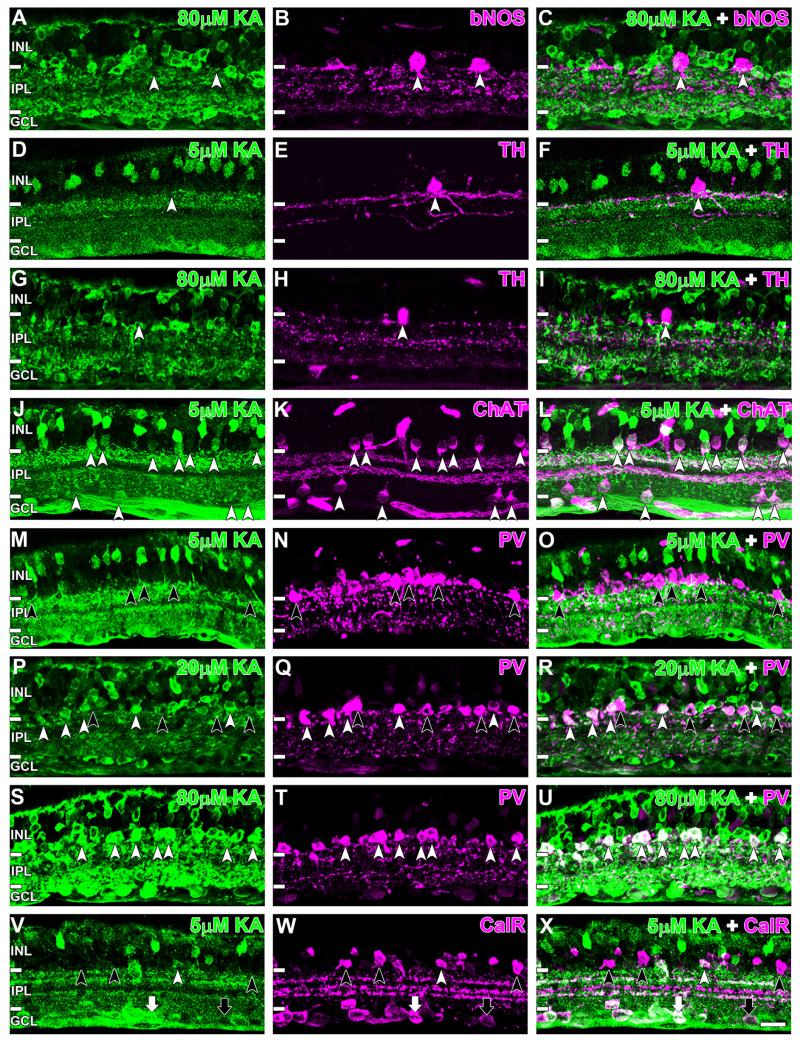
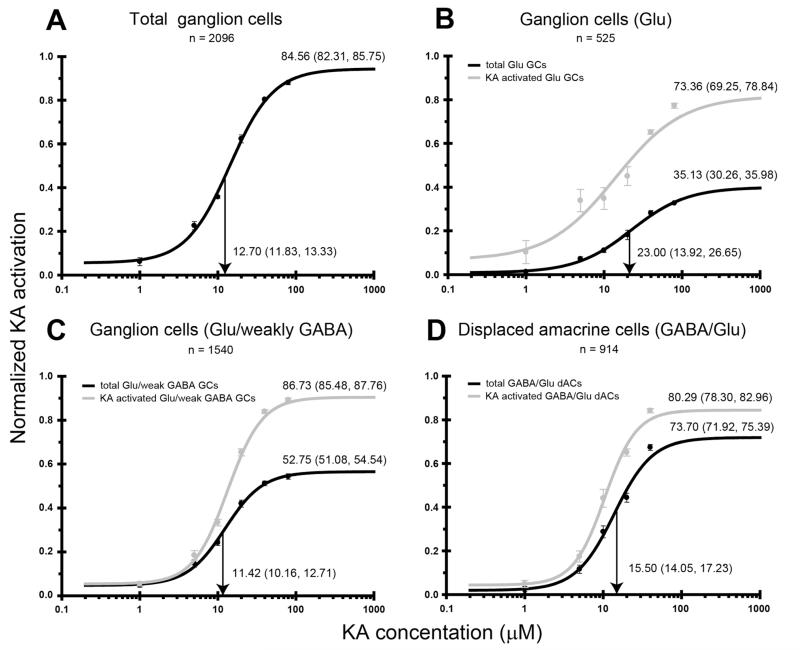
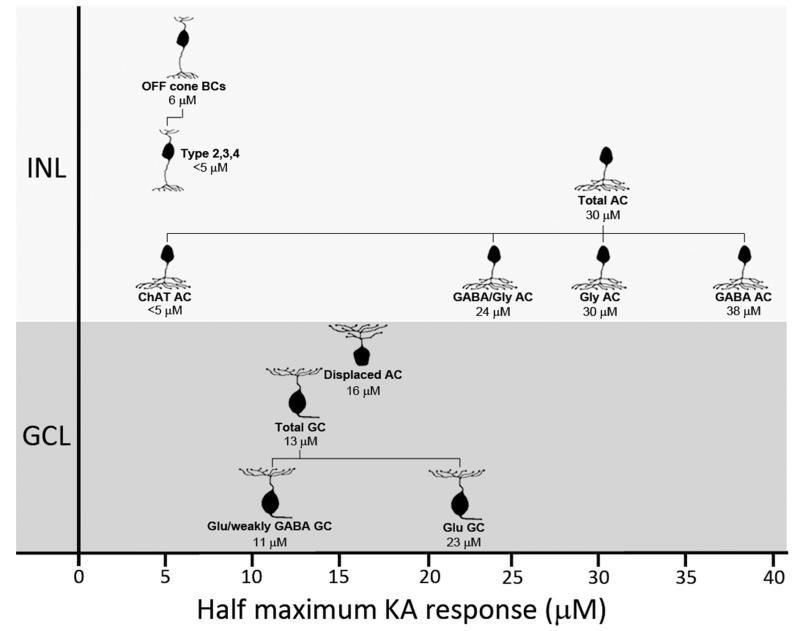
Kainate receptors mediate fast, excitatory synaptic transmission for a range of inner neurons in the mammalian retina. However, allocation of functional kainate receptors to known cell types and their sensitivity remains unresolved. Using the cation channel probe 1-amino-4-guanidobutane agmatine (AGB), we investigated kainate sensitivity of neurochemically identified cell populations within the structurally intact rat retina. Most inner retinal neuron populations responded to kainate in a concentration-dependent manner. OFF cone bipolar cells demonstrated the highest sensitivity of all inner neurons to kainate. Immunocytochemical localization of AGB and macromolecular markers confirmed that type 2 bipolar cells were part of this kainate-sensitive population. The majority of amacrine (ACs) and ganglion cells (GCs) showed kainate responses with different sensitivities between major neurochemical classes (γ-aminobutyric acid [GABA]/glycine ACs > glycine ACs > GABA ACs; glutamate [Glu]/weakly GABA GCs > Glu GCs). Conventional and displaced cholinergic ACs were highly responsive to kainate, whereas dopaminergic ACs do not appear to express functional kainate receptors. These findings further contribute to our understanding of neuronal networks in complex multicellular tissues.


Figures

Figure 1
Figure 1
Characterization of the chicken anti-AGB antibody. A: Dot blots show anti-agmatine binding to purified ovalbumin-glutaraldehyde–agmatine and ovalbumin–glutaraldehyde–glutamate conjugates. B: Density measures were converted to linear binding intensity, plotted against first-order binding curves (white circles, AGB; black circles, glutamate).
Figure 2
Figure 2
AGB immunoreactivity in the adult rat retina at (A, B) basal levels, (C,D) 5 μM kainate (KA) activation, (E,F) 20 μM KA activation, and (G,H) 80 μM KA activation. Sections were imaged with brightfield light microscopy using postembedding immunocytochemistry (A,C,E,G) or confocal microscopy using indirect immunofluorescence (B,D,F,H). Retinal layers including the inner nuclear layer (INL), inner plexiform layer (IPL), and ganglion cell layer (GCL) are indicated by white lines and annotations on the left-hand side of the image. The white arrow indicates weakly AGB-immunoreactive strata in the IPL. BC, bipolar cell; AC, amacrine cell; GC, ganglion cell. Scale bar = 20 μm in H (applies to A-H).
Figure 3
Figure 3
KA dose–response curves for OFF cone and total bipolar cell (BC) populations. The black line indicates the number of kainate (KA)-activated BCs in the cell population as a percentage of the total number of BCs present (n = 556). The gray line indicates the percentage of OFF BCs activated by KA. KA concentration is presented as a log 10 scale on the x-axis; percentage activation on the y-axis is presented as a normalized response where 1.0 indicates activation of 100% of the population. Annotations at the activation curve plateau indicate the mean total percentage of cells activated at saturating KA concentrations (80 μM KA). Vertical black arrows and their annotations delineate the half-maximal KA concentration. Bracketed values indicate the bounds of the 95% confidence interval. The data points in the dose–response curve have had the proportion of basal AGB-labeled cells subtracted so each datum point reflects true KA activation.
Figure 4
Figure 4
Confocal micrographs of AGB (green) and Islet-1 (Ist-1; magenta) immunoreactivity after activation with (A–C) 5 μM, (D–F) 20 μM, and (G–I) 80 μM kainate (KA). Activated bipolar cells (BCs; white arrowheads) did not colocalize with the Islet-1-positive-somata at any KA concentration used. Retinal layer annotations are the same as in Figure 2. Scale bar = 20 μm in I (applies to A–I).
Figure 5
Figure 5
Immunoreactivity of AGB (green) and the rod bipolar cell (BC) marker protein kinase C-α (PKCα; magenta) secondary to (A–C) 5 μM, (D–F) 20 μM, and (G–I) 80 μM kainate (KA) activation. PKCα did not colocalize with activated BCs (white arrowheads) at all KA concentrations shown. PKCα-immunoreactive axon terminals localized to sublamina b are indicated by the white arrow, and the KA-activated terminals are indicated by the black arrow. Retinal layer annotations are the same as in Figure 2. Scale bar = 20 μm in I (applies to A–I).
Figure 6
Figure 6
AGB (green) and neurokinin 3 receptor (NK3R; magenta) immunoreactivity after activation with (A–C) 5 μM, (D–F) 20 μM, and (G–I) 80 μM kainate (KA). At all activation concentrations, colocalization of some NK3R and KA-activated bipolar cells (BCs) was observed (white arrowheads). Some activated BCs were not immunoreactive for NK3R (black arrowheads). NK3R-immunoreactive BCs that were not activated by KA are marked with a black arrow. NK3R-immunoreactive axon terminals were exclusively localized to sublamina a, as indicated by the white arrow. Retinal layer annotations are the same as in Figure 2. Scale bar = 20 μm in I (applies to A–I).
Figure 7
Figure 7
AGB (green) and recoverin (Rec; magenta) immunoreactivity after activation with (A–C) 5 μM, (D–F) 20 μM, and (G–I) 80 μM kainate (KA). White arrowheads indicate recoverin-immunoreactive bipolar cells (BCs) activated by KA, and black arrowheads indicate recoverin BCs that were not activated. White arrows indicate the recoverin-positive axon terminals in sublamina a and b. Retinal layer annotations are the same as in Figure 2. Scale bar = 20 μm in I (applies to A–I).
Figure 8
Figure 8
Quantification of kainate (KA)-activated bipolar cell (BC) populations. A: Colocalization of KA-activated cells with BC markers. Each column represents the number of activated cells as a percentage of the total number of marker labeled cells. Numbers above each column indicate the total number of cells counted for each marker at that KA concentration, and the asterisk indicates a significant difference (one-way ANOVA, P < 0.05). B: KA-activated cells void of marker immunoreactivity. Columns represent the number of KA-activated but marker-negative cells as a percentage of all cells activated. Numbers above each column indicate the total number of activated cells (i.e., AGB positive) at that KA concentration. For both figures, data are the mean and SD from five independent rat retinae.
Figure 9
Figure 9
Immunoreactivity of (A) AGB (green), (B) recoverin (magenta), and (C) islet-1 (blue) after activation with 80 μM kainate (KA). D: Overlap of AGB and recoverin channels shows that many recoverin BCs were activated by KA (white arrowheads) but not all (black arrow-heads). E: Overlap of recoverin and Islet-1 channels. Type 8 BCs are identified by colocalization of recoverin and Islet-1 (black arrow-heads), and type 2 are identified by the absence of Islet-1 staining (white arrowheads). F: Overlap of all three markers. Type 8 BCs are not activated by KA (black arrowheads), whereas type 2 BCs are activated by KA. Retinal layer annotations are the same as in Figure 2. G: Quantification of recoverin BC populations with functional KA receptors. The two cell types are presented as a percentage of the total recoverin BC population (5 μM: n = 735; 20 μM: n = 599; 80 μM: n = 455). Each column represents the mean and SD from five independent rat retinae. Abbreviations: Rec, recoverin; Ist-1, islet-1; BC, bipolar cell. Scale bar = 20 μm in F (applies to A–F).
Figure 10
Figure 10
Kainate (KA) dose-response curves for neurochemically distinct AC populations in the inner nuclear layer. Activation curves are presented for (A) all amacrine cells (ACs) within the AC layer, (B) γ-aminobutyric acid (GABA)-immunoreactive ACs, (C) glycine (Gly)-immunoreactive ACs, and (D) GABA/Gly-immunoreactive AC populations. The black lines indicate the number KA-activated cells in the cell population as a percentage of the total number of activated cells present. The gray lines indicate the percentage of cells within a neurochemical class that are activated by KA. Activation curve annotations and axes labeling are as described in Figure 3.
Figure 11
Figure 11
Kainate (KA) activation of immunocytochemically identified AC populations. A–C: Brain nitric oxide synthase (bNOS)-immunoreactive ACs were not activated by KA even at saturating levels (white arrowheads). D–F: Tyrosine hydroxylase (TH)-immunoreactive ACs also did not colocalize with KA-activated ACs at low or saturating KA concentrations (white arrowheads). G–I: Colocalization was evident between AGB and choline acetyltranferase (ChAT)-reactive ACs (white arrowheads). M–U: Parvalbumin (PV)-positive ACs were activated with KA concentrations exceeding 5 μM. M–O: No colocalization was observed for incubations with 5 μM KA (black arrowheads). P–R: At 20 μM, most PV ACs were colocalized (white arrowheads), but some remained AGB negative (black arrowheads). S–U: All PV-immunoreactive cells were colocalized with KA-activated cells at 80 μM (white arrowheads). V–X: Colocalization with KA-activated cells was observed for some calretinin-positive ACs (white arrowheads) but not others (black arrowheads). Similarly, some calretinin-reactive cells in the ganglion cell layer colocalized with KA-activated GCs (white arrow) and others did not (black arrow). Retinal layer annotations are the same as in Figure 2. Scale bar = 20 μm in X (applies to A–X).
Figure 12
Figure 12
Kainate (KA) dose-response curves for neurochemically distinct cell populations in the ganglion cell layer. Activation curves are presented for (A) all ganglion cells (GCs) within the ganglion cell layer, (B) glutamate (Glu)-immunoreactive GCs, (C) Glu/weakly γ-aminobutyric acid (GABA)-immunoreactive GCs, and (D) displaced amacrine cells (ACs). The black lines indicate the number of KA-activated cells in the cell population as a percentage of the total number of activated cells present. The gray lines indicate the percentage of cells within a neurochemical class that are activated by KA. Activation curve annotations and axes labeling are as described in Figure 3.
Figure 13
Figure 13
Diagrammatic representation of kainate (KA) sensitivity of various neurochemically identified cell populations in the rat inner retina. Annotations below cell images indicate the neurochemical cell class and the half-maximal activation concentration for that class. Data are based on dose activation curves in Figures 3, 10, and 12. For Chat ACs and type 2, 3, and 4 BCs, estimates of half-maximum concentration have been made from immunolabeling. Abbreviations: INL, inner nuclear layer; GCL, ganglion cell layer; BC, bipolar cell; AC, amacrine cell; GC, ganglion cell; GABA, γ-aminobutyric acid; Gly, glycine; Glu, glutamate.

Similar articles

Cited by

References

    1. Acosta ML, Chua J, Kalloniatis M. Functional activation of glutamate ionotropic receptors in the developing mouse retina. J Comp Neurol. 2007;500:923–941. - PubMed
    1. Andrade da Costa BL, de Mello FG, Hokoc JN. Comparative study of glutamate mediated gamma-aminobutyric acid release from nitric oxide synthase and tyrosine hydroxylase immunoreactive cells of the Cebus apella retina. Neurosci Lett. 2001;302:21–24. - PubMed
    1. Brandstätter JH, Hartveit E, Sassoe-Pognetto M, Wässle H. Expression of NMDA and high-affinity kainate receptor subunit mRNAs in the adult rat retina. Eur J Neurosci. 1994;6:1100–1112. - PubMed
    1. Brandstätter JH, Koulen P, Wässle H. Selective synaptic distribution of kainate receptor subunits in the two plexiform layers of the rat retina. J Neurosci. 1997;17:9298–9307. - PMC - PubMed
    1. Breuninger T, Puller C, Haverkamp S, Euler T. Chromatic bipolar cell pathways in the mouse retina. J Neurosci. 2011;31:6504–6517. - PMC - PubMed

Publication types

MeSH terms

LinkOut - more resources