. 2013 Feb;123(2):887-902.
doi: 10.1172/JCI65647. Epub 2013 Jan 25.

Blockade of NOX2 and STIM1 signaling limits lipopolysaccharide-induced vascular inflammation

Affiliations

Blockade of NOX2 and STIM1 signaling limits lipopolysaccharide-induced vascular inflammation

Rajesh Kumar Gandhirajan et al. J Clin Invest. 2013 Feb.

Abstract

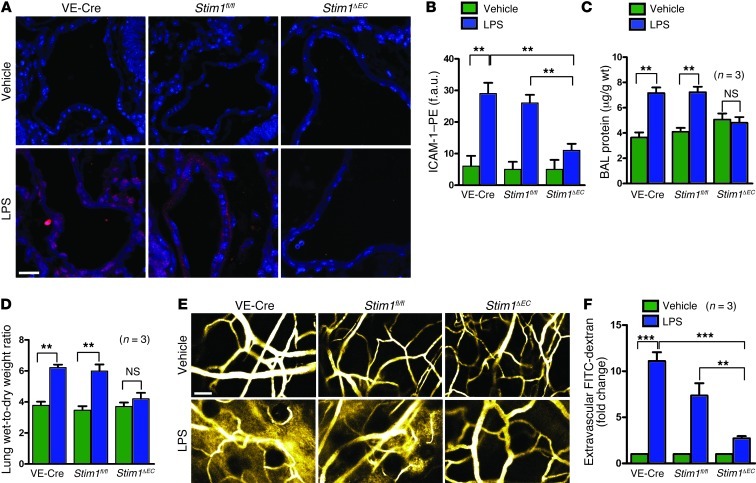
During sepsis, acute lung injury (ALI) results from activation of innate immune cells and endothelial cells by endotoxins, leading to systemic inflammation through proinflammatory cytokine overproduction, oxidative stress, and intracellular Ca2+ overload. Despite considerable investigation, the underlying molecular mechanism(s) leading to LPS-induced ALI remain elusive. To determine whether stromal interaction molecule 1-dependent (STIM1-dependent) signaling drives endothelial dysfunction in response to LPS, we investigated oxidative and STIM1 signaling of EC-specific Stim1-knockout mice. Here we report that LPS-mediated Ca2+ oscillations are ablated in ECs deficient in Nox2, Stim1, and type II inositol triphosphate receptor (Itpr2). LPS-induced nuclear factor of activated T cells (NFAT) nuclear accumulation was abrogated by either antioxidant supplementation or Ca2+ chelation. Moreover, ECs lacking either Nox2 or Stim1 failed to trigger store-operated Ca2+ entry (SOCe) and NFAT nuclear accumulation. LPS-induced vascular permeability changes were reduced in EC-specific Stim1-/- mice, despite elevation of systemic cytokine levels. Additionally, inhibition of STIM1 signaling prevented receptor-interacting protein 3-dependent (RIP3-dependent) EC death. Remarkably, BTP2, a small-molecule calcium release-activated calcium (CRAC) channel blocker administered after insult, halted LPS-induced vascular leakage and pulmonary edema. These results indicate that ROS-driven Ca2+ signaling promotes vascular barrier dysfunction and that the SOCe machinery may provide crucial therapeutic targets to limit sepsis-induced ALI.


Figures

Figure 1
Figure 1. Characterization of Stim1ΔEC mice.
(A) Photograph of litter-matched wild-type (Cre–/– Stim1WT/WT) and Cre+ Stim1ΔEC mice at 4 weeks. (B) Genotyping results of wild-type, heterozygous, and knockout animals. (C) Representative photomicrographs of double immunohistochemistry staining from aortic cross sections with CD31 (green) and STIM1 (red) in wild-type and Stim1ΔEC mice. Scale bar: 50 μm. Pulmonary ECs were isolated from wild-type, heterozygous, and Stim1-knockout mice by positive selection using Miltenyi Biotec μMACS technology. (D) Protein expression levels of STIM1 and STIM2. (E) FACS analysis of leukocytes (CD45+) and T cells (CD3+) for intracellular STIM1 expression in wild-type and Stim1ΔEC mice. A488, Alexa Fluor 488. (F) Fluo-4–loaded VE-Cre, Stim1fl/fl, and Stim1ΔEC ECs were treated with thapsigargin (Tg; 2 μM) under nominally Ca2+-free conditions, and 2 mM Ca2+ was applied to assess SOCe. f.a.u., fluorescence arbitrary units. Data are mean ± SEM.
Figure 2
Figure 2. Stim1ΔEC mice have normal pulmonary vasculature and endothelial migration.
(A) NOX2 protein levels in ECs. (B) Representative images and (C) quantification of DHE fluorescence in ECs derived from wild-type and Stim1ΔEC mice. Scale bar: 20 μm. (D) Representative images and quantification of gap closure in ECs derived from wild-type and Stim1ΔEC mice at 24 hours. (E) Assessment of pulmonary vascular distribution by 2-photon imaging in 5-week-old litter-matched wild-type and Stim1ΔEC mice after FITC-dextran administration. Bar graph shows quantification of mean alveolar space from E. Scale bar: 100 μm. Data are mean ± SEM.
Figure 3
Figure 3. Genetic ablation of Stim1 in endothelium limits LPS-induced leukocyte infiltration and BAL inflammatory cytokines.
VE-Cre, Stim1fl/fl, and Stim1ΔEC mice were challenged with LPS (1 mg/kg; i.p.). Saline was used as a vehicle control. (A) Representative photomicrographs of H&E-stained lung sections. (B) Quantification of alveolar leukocyte infiltration. (C) IL-1α, IL-1β, IL-2, IL-6, TNF-α, and G-CSF were measured in sera from mice. (D) IL-1α, IL-1β, IL-2, IL-6, TNF-α, and G-CSF were measured in BAL fluid from VE-Cre, Stim1fl/fl, and Stim1ΔEC mice. Data are mean ± SEM. *P < 0.05,**P < 0.01, ***P < 0.001.
Figure 4
Figure 4. Stim1 deletion in endothelium attenuates LPS-induced pulmonary vascular dysfunction.
(A) Representative immunohistochemistry images of ICAM-1 using PE in lung sections from treated mice. Scale bar: 20 μm. (B) Quantification of ICAM-1 expression based on fluorescence intensity. (C) BAL protein content and (D) lung weight changes are a functional measure of EC activation associated with increased vascular permeability. (E) A 0.1- to 0.15-ml bolus of FITC-dextran (70 kDa, 5%w/v) was injected into the animals via facial vein. Anesthetized animals were placed under an intravital 2-photon imaging system, and images were acquired. Vascular permeability was assessed based on fluorescence intensity in the extravascular space. Scale bar: 100 μm. (F) Quantification of extravascular FITC-dextran fluorescence intensity. Data are mean ± SEM. **P < 0.01, ***P < 0.001.
Figure 5
Figure 5. STIM1-mediated NFAT activity is necessary for LPS-induced proinflammatory gene expression in ECs.
(A) Ex vivo imaging of pulmonary vascular Ca2+ levels in freshly prepared lung slices from wild-type mice challenged with LPS (1 mg/kg) for 20 hours. AcLDL was used as an endothelial marker. Scale bar: 50 μm. (B) Quantification of Fluo-4 fluorescence was measured from multiple regions of the lung slices. ECs from wild-type and Stim1ΔEC mice were challenged with LPS (1 μg/ml) for 16 hours. ECs were loaded for 30 minutes with Fluo-4/AM. (C) Representative traces from wild-type and Stim1ΔEC ECs. (D) Quantification of oscillation frequency. ECs from wild-type and Stim1ΔEC mice were transduced with adenovirus encoding NFATc3-GFP for 36 hours. Following adenoviral transduction, ECs were treated with LPS for 16 hours. (E) Representative images showing NFAT nuclear translocation. Scale bar: 20 μm. Arrowheads indicate the nuclear translocated NFAT. (F) Quantification of nuclear NFAT-positive cells. (G) NFAT-dependent luciferase activity was measured in wild-type and Stim1 KD ECs 16 hours after LPS (1 μg/ml) treatment. (H) Quantification of cytokine protein expression in wild-type and Stim1ΔEC ECs treated with LPS for 16 hours. Data are mean ± SEM. *P < 0.05, **P < 0.01, ***P < 0.001.
Figure 6
Figure 6. NOX2-derived ROS promotes STIM1-dependent Ca2+ entry and NFAT activation after LPS stimulation.
Wild-type, gp91phox–/–, and Stim1 KD ECs were treated with LPS (1 μg/ml) for 16 hours. (AC) Extracellular Ca2+ was removed for 5 minutes prior to assessment of SOCe activity in (A) wild-type, (B) gp91phox–/–, and (C) Stim1 KD ECs. Wild-type, gp91phox–/–, and Stim1 KD ECs were transduced with adenovirus encoding NFATc3-GFP for 36 hours and then treated with LPS (1 μg/ml) for an additional 16 hours. (D) Quantification of nuclear NFAT-positive cells. (E) gp91phox–/– cells loaded with Fluo-4 were treated with thapsigargin (2 μM) under nominally Ca2+-free conditions, followed by addition of 2 mM Ca2+ where indicated to assess SOCe. (F) Fluo-4–loaded gp91phox–/– ECs were treated with (right) or without (left) superoxide (xanthine + xanthine oxidase [O2.]; 10 nmol/min). (G) gp91phox–/– ECs were transduced with AdNFATc3-GFP for 36 hours, and nuclear NFATc3-GFP was quantified after O2. exposure. Scale bar: 20 μm. (H) gp91phox–/– ECs were transfected with either STIM1 wild-type or STIM1 C56A mutant constructs. Extracellular Ca2+ was removed for 5 minutes prior to the measurement of SOCe activity in Fluo-4–loaded ECs. (I) gp91phox–/– ECs transiently expressing either wild-type or STIM1 C56A plasmids were transduced with AdNFATc3-GFP for 36 hours, and nuclear NFATc3GFP was quantified. Scale bar: 20 μm. All data are the mean ± SEM of 3 independent experiments, each experiment consisting of triplicate analyses of 20–30 cells. **P < 0.01, ***P < 0.001.
Figure 7
Figure 7. Ablation of STIM1 abrogates LPS-induced EC death.
(A) Wild-type, Stim1 KD, and gp91phox–/– ECs stimulated with LPS (1 μg/ml) for 48 hours were stained using Annexin V–Alexa Fluor 488 and PI as cell death markers, and Hoechst 33342 was used as a nuclear marker as described in Methods. (B) Quantification of dead cells. Scale bar: 20 μm. Data are mean ± SEM. **P < 0.01, ***P < 0.001.
Figure 8
Figure 8. LPS-induced RIP3 expression is downregulated in Stim1ΔEC mice.
(A) Immunohistochemical labeling of RIP3 in lung endothelium from VE-Cre, Stim1fl/fl, and Stim1ΔEC mice 24 hours after LPS challenge. Scale bar: 30 μm. (B) Quantification of RIP3 fluorescence intensity in A. (C) Immunohistochemical labeling of RIP3 in lung endothelium from C57BL/6 wild-type mice after i.p. delivery of saline (vehicle) or LPS (1 mg/kg; 24 hours). BTP2 (1 mg/kg) was delivered i.p. 2 hours after LPS challenge. Scale bar: 20 μm. (D) Quantification of RIP3 fluorescence intensity in C. (E) Proposed scheme depicts signal transduction cascade in LPS-induced vascular dysfunction during ALI. Data are mean ± SEM. **P < 0.01.
Figure 9
Figure 9. BTP2 attenuates LPS-induced lung inflammation and vascular endothelial integrity loss.
C57BL/6 mice were challenged with LPS (1 mg/kg; i.p.), and BTP2 (1 mg/kg; i.p.) was delivered 2 hours after challenge. Saline was used as a vehicle. Samples were collected after 24 hours. (A) IL-1α, IL-1β, IL-2, IL-6, TNF-α, and G-CSF were measured in sera from mice. (B) Representative photomicrographs of H&E-stained lung sections. Original magnification, ×400. (C) Quantification of alveolar leukocytes infiltration. (D) Representative Western blot of ICAM-1 induction in ECs treated with LPS and/or BTP2. (E) Representative immunohistochemistry images of ICAM-1 using PE in lung sections from treated mice. Scale bar: 20 μm. (F) Quantification of ICAM-1 fluorescence intensity. (G and H) BAL protein content (G) and lung weight (H) changes are a functional measure of EC activation associated with increased vascular permeability. (I) A 0.1- to 0.15-ml bolus of FITC-dextran (70 kDa, 5%w/v) was injected into the animals via facial vein. Anesthetized animals were placed under an intravital 2-photon imaging system, and images were acquired. Vascular permeability was assessed based on fluorescence intensity in the extravascular space around 4–5 regions per mouse. Scale bar: 100 μm. (J) Quantification of extravascular FITC-dextran fluorescence. Cumulative data are the mean ± SEM of triplicates and are representative of 3 independent experiments with 3–6 per group as indicated. *P < 0.05, **P < 0.01, ***P < 0.001.

Comment in

Similar articles

Cited by

References

    1. Russell JA. Management of sepsis. N Engl J Med. 2006;355(16):1699–1713. doi: 10.1056/NEJMra043632. - DOI - PubMed
    1. Angus DC, Linde-Zwirble WT, Lidicker J, Clermont G, Carcillo J, Pinsky MR. Epidemiology of severe sepsis in the United States: analysis of incidence, outcome, and associated costs of care. Crit Care Med. 2001;29(7):1303–1310. doi: 10.1097/00003246-200107000-00002. - DOI - PubMed
    1. Hotchkiss RS, Karl IE. The pathophysiology and treatment of sepsis. N Engl J Med. 2003;348(2):138–150. doi: 10.1056/NEJMra021333. - DOI - PubMed
    1. Martin GS, Mannino DM, Eaton S, Moss M. The epidemiology of sepsis in the United States from 1979 through 2000. N Engl J Med. 2003;348(16):1546–1554. doi: 10.1056/NEJMoa022139. - DOI - PubMed
    1. Mehta D, Malik AB. Signaling mechanisms regulating endothelial permeability. Physiol Rev. 2006;86(1):279–367. doi: 10.1152/physrev.00012.2005. - DOI - PubMed

Publication types

MeSH terms