

Development and characterization of 89Zr-labeled panitumumab for immuno-positron emission tomographic imaging of the epidermal growth factor receptor
- PMID: 23348788
- PMCID: PMC4329987
Development and characterization of 89Zr-labeled panitumumab for immuno-positron emission tomographic imaging of the epidermal growth factor receptor
Abstract
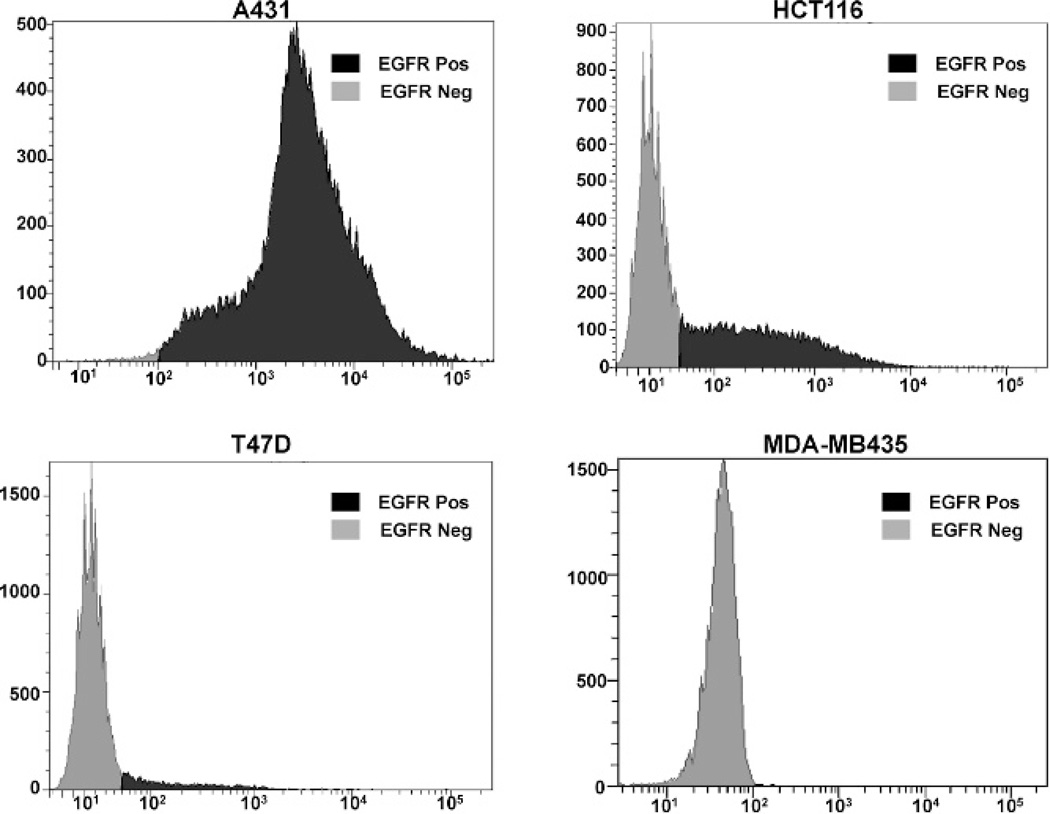
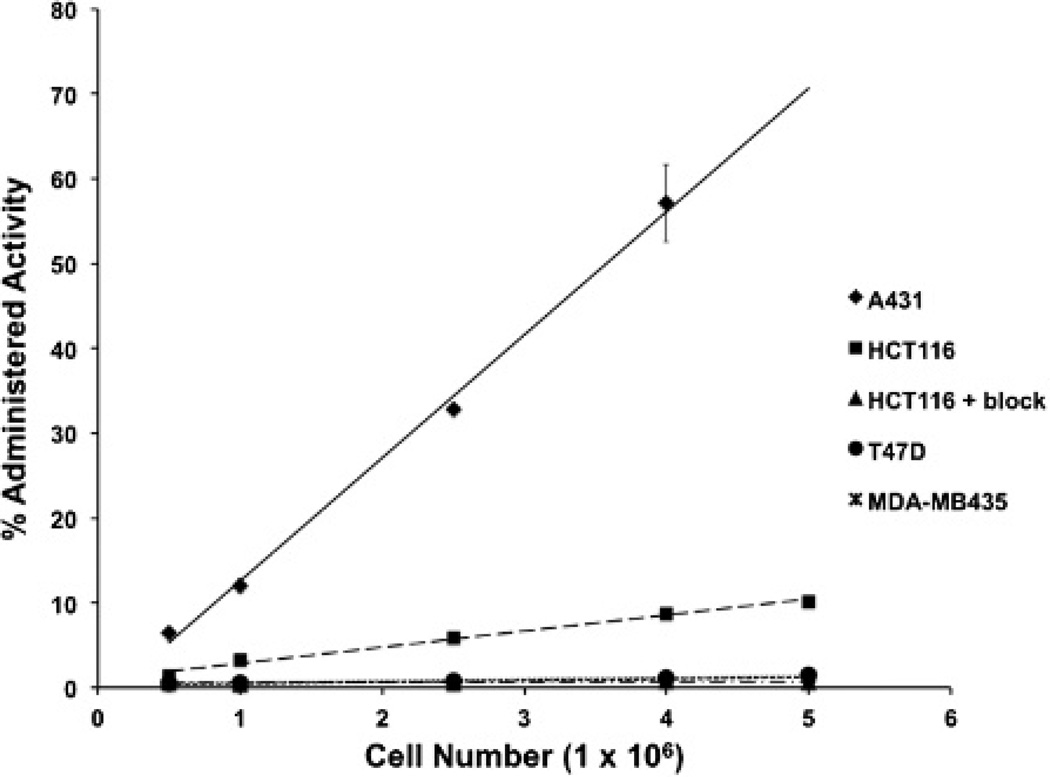
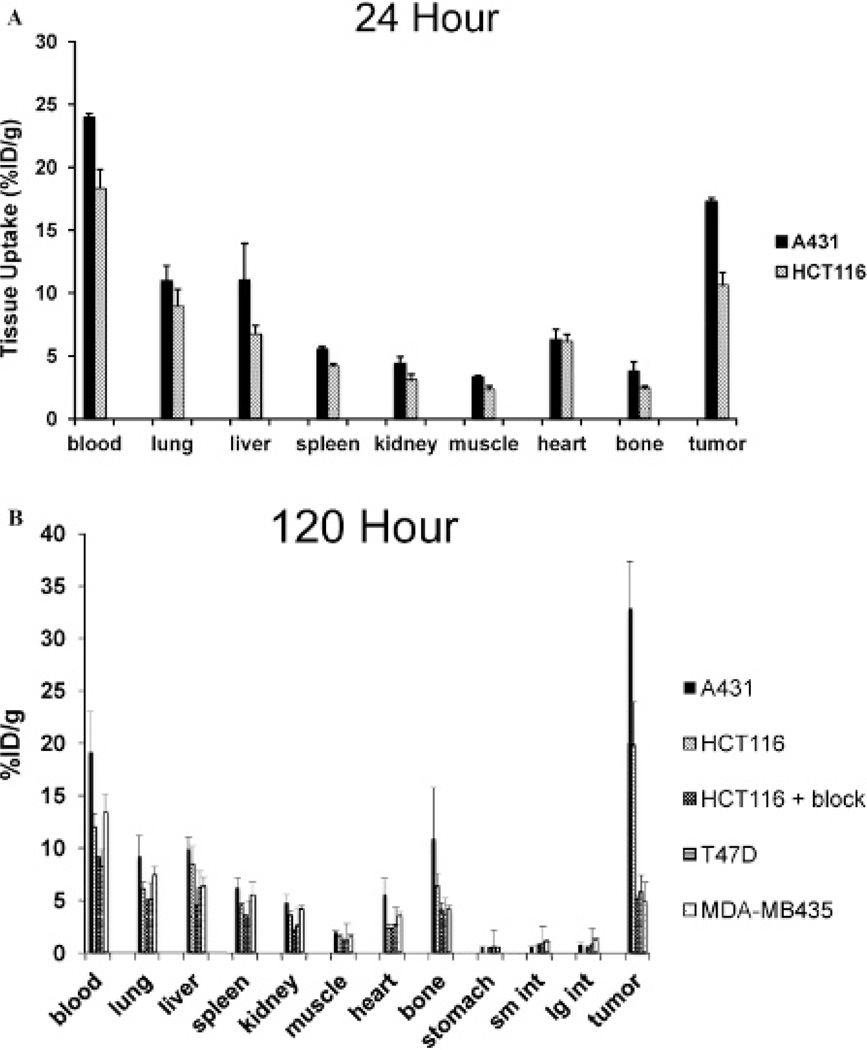
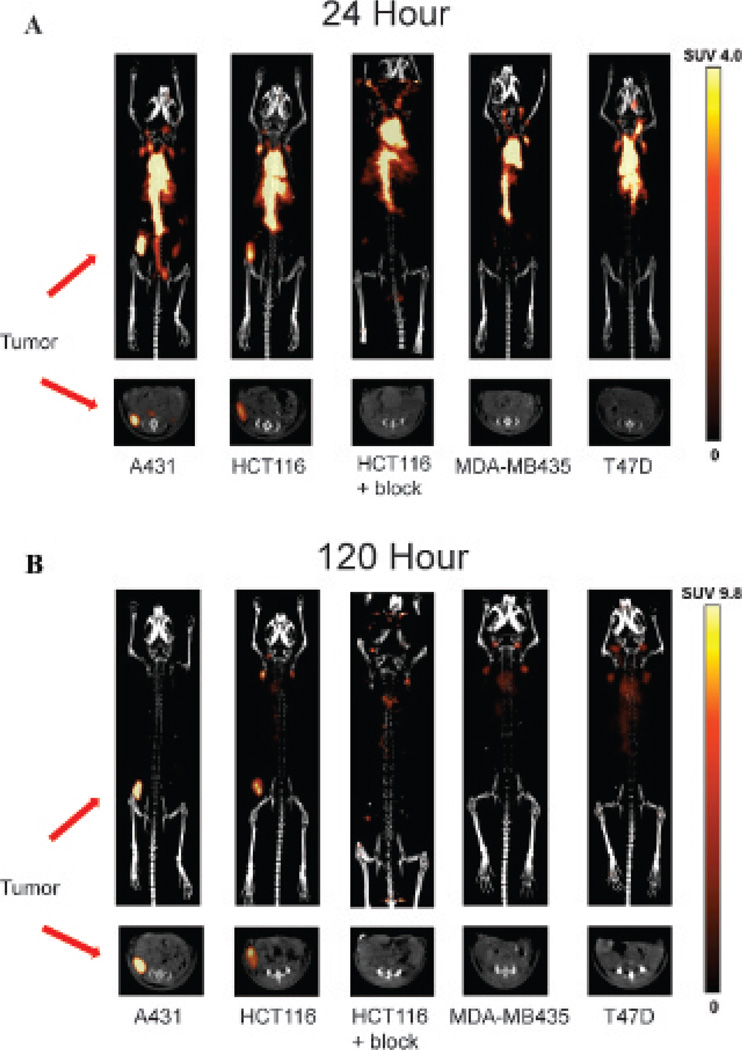
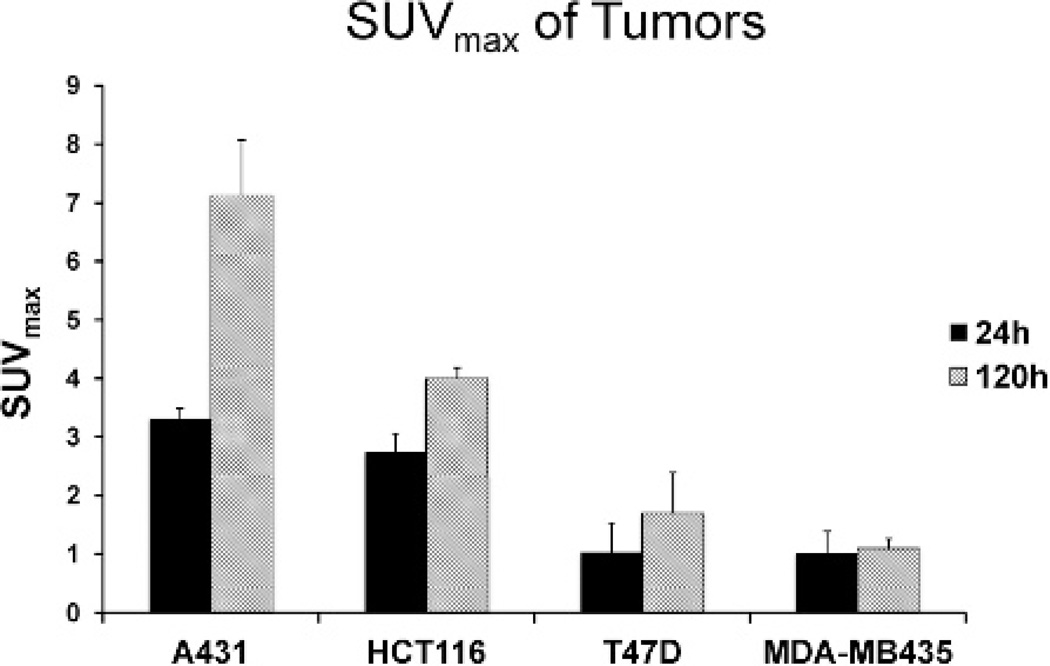
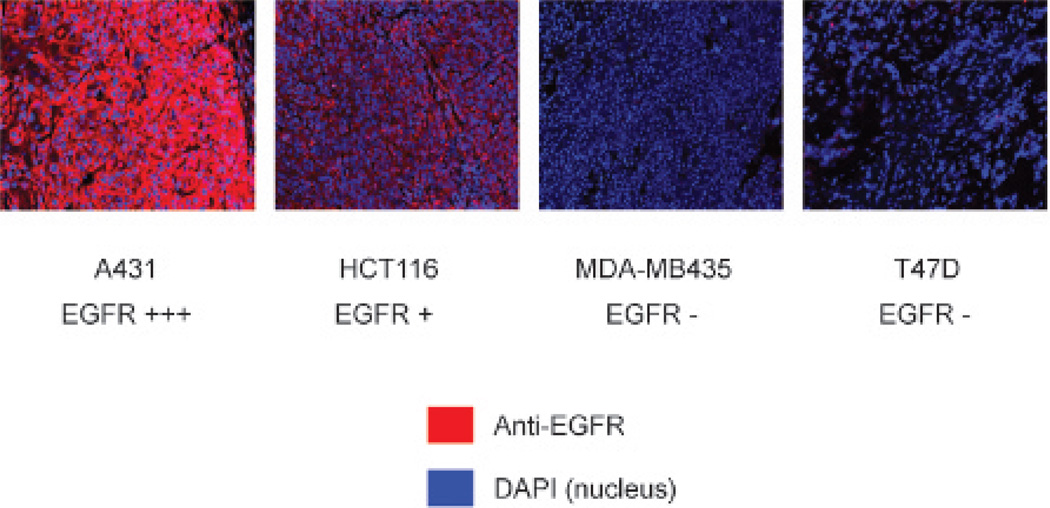
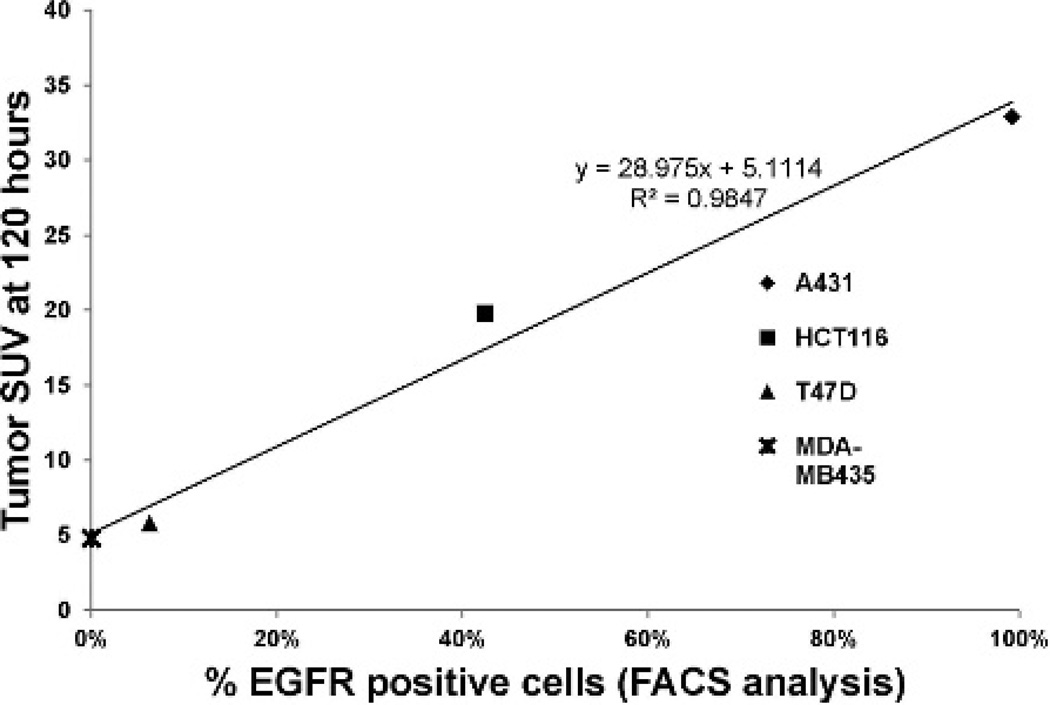
The epidermal growth factor receptor (EGFR) is overexpressed in the majority of malignancies and has been associated with poor outcomes. Panitumumab, an anti-EGFR monoclonal antibody that binds to the extracellular binding domain of EGFR, is increasingly used with radiotherapy and chemotherapy but has associated toxicities. The purpose of this study was to develop and characterize a novel targeted imaging agent for the EGFR using radiolabeled panitumumab. Flow cytometry studies were performed to evaluate EGFR expression in several cell lines. Desferrioxamine-Bz-NCS (DFO) was conjugated to panitumumab and labeled with (89)Zr. Cell uptake studies were performed in four cell lines. For biodistribution studies and micro-positron emission tomography/computed tomography (PET/CT), mouse xenograft models were generated using the same cell lines. PET was performed, and tumors and select organs were harvested for biodistribution studies. Panitumumab was radiolabeled with (89)Zr with high radiochemical purity and specific activity and was found to be stable in serum. Cell binding studies demonstrated that radiotracer uptake in cells correlated with the degree of EGFR expression. MicroPET/CT imaging studies demonstrated a high intensity of (89)Zr-panitumumab in A431 and HCT 116 tumors in comparison with the EGFR-negative tumors. Biodistribution studies confirmed the results from the imaging studies. (89)Zr-panitumumab imaging of EGFR-positive tumors demonstrated levels of radiotracer uptake associated with EGFR expression.
Figures
Similar articles
-
Zirconium-89 labeled panitumumab: a potential immuno-PET probe for HER1-expressing carcinomas.Nucl Med Biol. 2013 May;40(4):451-7. doi: 10.1016/j.nucmedbio.2013.01.007. Epub 2013 Feb 27. Nucl Med Biol. 2013. PMID: 23454247 Free PMC article.
-
Immuno-PET Imaging of CD30-Positive Lymphoma Using 89Zr-Desferrioxamine-Labeled CD30-Specific AC-10 Antibody.J Nucl Med. 2016 Jan;57(1):96-102. doi: 10.2967/jnumed.115.162735. Epub 2015 Oct 29. J Nucl Med. 2016. PMID: 26514172
-
p-Isothiocyanatobenzyl-desferrioxamine: a new bifunctional chelate for facile radiolabeling of monoclonal antibodies with zirconium-89 for immuno-PET imaging.Eur J Nucl Med Mol Imaging. 2010 Feb;37(2):250-9. doi: 10.1007/s00259-009-1263-1. Epub 2009 Sep 18. Eur J Nucl Med Mol Imaging. 2010. PMID: 19763566 Free PMC article.
-
89Zr-Labeled p-isothiocyanatobenzyl-desferrioxamine B (Df-Bz-NCS)–conjugated panitumumab, a fully human monoclonal antibody directed against the extracellular domain III of the epidermal growth factor receptor.2012 May 4 [updated 2012 Jun 21]. In: Molecular Imaging and Contrast Agent Database (MICAD) [Internet]. Bethesda (MD): National Center for Biotechnology Information (US); 2004–2013. 2012 May 4 [updated 2012 Jun 21]. In: Molecular Imaging and Contrast Agent Database (MICAD) [Internet]. Bethesda (MD): National Center for Biotechnology Information (US); 2004–2013. PMID: 22741179 Free Books & Documents. Review.
-
89Zr-Desferrioxamine p-isothiocyanatobenzyl-anti-EGFR nanobody 7D12.2012 Mar 21 [updated 2012 Jun 7]. In: Molecular Imaging and Contrast Agent Database (MICAD) [Internet]. Bethesda (MD): National Center for Biotechnology Information (US); 2004–2013. 2012 Mar 21 [updated 2012 Jun 7]. In: Molecular Imaging and Contrast Agent Database (MICAD) [Internet]. Bethesda (MD): National Center for Biotechnology Information (US); 2004–2013. PMID: 22696779 Free Books & Documents. Review.
Cited by
-
Towards Radiolabeled EGFR-Specific Peptides: Alternatives to GE11.Pharmaceuticals (Basel). 2023 Feb 11;16(2):273. doi: 10.3390/ph16020273. Pharmaceuticals (Basel). 2023. PMID: 37259420 Free PMC article.
-
Infrared Fluorescence-guided Surgery for Tumor and Metastatic Lymph Node Detection in Head and Neck Cancer.Radiol Imaging Cancer. 2024 Jul;6(4):e230178. doi: 10.1148/rycan.230178. Radiol Imaging Cancer. 2024. PMID: 38940689 Free PMC article. Review.
-
ImmunoPET: Concept, Design, and Applications.Chem Rev. 2020 Apr 22;120(8):3787-3851. doi: 10.1021/acs.chemrev.9b00738. Epub 2020 Mar 23. Chem Rev. 2020. PMID: 32202104 Free PMC article. Review.
-
Radiolabeled Antibodies for Cancer Imaging and Therapy.Cancers (Basel). 2022 Mar 11;14(6):1454. doi: 10.3390/cancers14061454. Cancers (Basel). 2022. PMID: 35326605 Free PMC article. Review.
-
Cyclic versus Noncyclic Chelating Scaffold for 89Zr-Labeled ZEGFR:2377 Affibody Bioconjugates Targeting Epidermal Growth Factor Receptor Overexpression.Mol Pharm. 2018 Jan 2;15(1):175-185. doi: 10.1021/acs.molpharmaceut.7b00787. Epub 2017 Dec 1. Mol Pharm. 2018. PMID: 29160082 Free PMC article.
References
-
- Lurje G, Lenz HJ. EGFR signaling and drug discovery. Oncology. 2009;77:400–410. - PubMed
-
- Mendelsohn J, Baselga J. Epidermal growth factor receptor targeting in cancer. Semin Oncol. 2006;33:369–485. - PubMed
-
- Yarden Y, Sliwkowski MX. Untangling the ErbB signalling network. Nat Rev. 2001;2:127–137. - PubMed
-
- Kotsakis A, Georgoulias V. Targeting epidermal growth factor receptor in the treatment of non-small-cell lung cancer. Expert Opin Pharmacother. 2010;11:2363–2389. - PubMed
-
- Grothey A. EGFR antibodies in colorectal cancer: where do they belong? J Clin Oncol. 2010;28:4668–4670. - PubMed
MeSH terms
Substances
Grants and funding
LinkOut - more resources
Full Text Sources
Other Literature Sources
Research Materials
Miscellaneous