. 2013 Jun;26(6):849-59.
doi: 10.1038/modpathol.2012.238. Epub 2013 Jan 25.

Prostate cancer cell phenotypes based on AGR2 and CD10 expression

Affiliations

Prostate cancer cell phenotypes based on AGR2 and CD10 expression

Melissa E Ho et al. Mod Pathol. 2013 Jun.

Abstract

The combination of expression patterns of AGR2 (anterior gradient 2) and CD10 by prostate cancer provided four phenotypes that correlated with clinical outcome. Based on immunophenotyping, CD10(low)AGR2(high), CD10(high)AGR2(high), CD10(low)AGR2(low), and CD10(high)AGR2(low) were distinguished. AGR2(+) tumors were associated with longer recurrence-free survival and CD10(+) tumors with shorter recurrence-free survival. In high-stage cases, the CD10(low)AGR2(high) phenotype was associated with a ninefold higher recurrence-free survival than the CD10(high)AGR2(low) phenotype. The CD10(high)AGR2(high) and CD10(low)AGR2(low) phenotypes were intermediate. The CD10(high)AGR2(low) phenotype was most frequent in high-grade primary tumors. Conversely, bone and other soft tissue metastases, and derivative xenografts, expressed more AGR2 and less CD10. AGR2 protein was readily detected in tumor metastases. The CD10(high)AGR2(low) phenotype in primary tumors is predictive of poor outcome; however, the CD10(low)AGR2(high) phenotype is more common in metastases. It appears that AGR2 has a protective function in primary tumors but may have a role in the distal spread of tumor cells.


Conflict of interest statement

Disclosure/conflict of interest

The authors declare no conflict of interest.

Figures

Figure 1
Figure 1
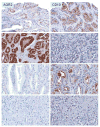
AGR2 and CD10 expression in prostate cancer. Top: tumor glands in specimen 99-010D are AGR2+CD10CD26+, whereas benign glands are AGR2CD10+CD26+. Bottom: PIN glands in 99-010D show the same phenotype as cancer glands. Magnification 100x.
Figure 2
Figure 2
Cancer progression. The Kaplan-Meier plot shows the outcome of high-stage patients grouped by CD10 and AGR2 expression. At 5 years, 85% of CD10lowAGR2high were recurrence-free compared to just 25% of CD10highAGR2low.
Figure 3
Figure 3
Primary cancer cell phenotypes. Shown are examples of the four different cancer cell phenotypes based on CD10 and AGR2 immunostaining. Magnification 100x.
Figure 4
Figure 4
Metastasis phenotypes. Shown are four representative tissue microarray sections of bone and soft tissue metastases, identified by case numbers, stained for AGR2 and CD10. Their AGR2/CD10 phenotypes are indicated. All four show strong AGR2 reactivity, while only two show moderate to weak CD10 reactivity. Magnification is 40x.
Figure 5
Figure 5
AGR2 and CD10 RNA expression levels. Shown are AGR2 staining of 07-050EE1 (top section: top two panels magnification 100x and bottom left magnification 200x) and 00-1140FF (top section: bottom right magnification 100x). AGR2 staining is cytoplasmic. Small cell carcinoma in 05-144EE2 (middle section) is negative for AGR2 (left magnification 100x, right magnification 200x). DNA array analysis data of metastases (bottom section) are shown with arrows over the three immunostained specimens shown in the Figure. Increased AGR2 expression is denoted by the high CY3 intensity values (red arrows: 27870 and 65828) and decreased expression by values (black arrow: 1297). Note the generally lower CY3 intensity values for CD10.
Figure 6
Figure 6
Quantitative measurement of AGR2 in tissue. The metastasis specimens (* to indicate from surgery not autopsy) identified on the x-axis were minced and digested by collagenase in culture media overnight, and the cell-free media supernatant was assayed by AGR2 ELISA. OD405 readings are indicated on the y-axis. The line indicates the level obtained with buffer/media only. Levels in culture supernatant of C4-2, C4-2B, PC3 and CL1 are included for comparison.
Figure 7
Figure 7
Cancer cell AGR2/CD10 RNA expression levels. Levels were determined through DNA microarray analysis with signal intensity values on the y-axis. Indicated on the x-axis are G3 and G4 primary tumor cell types, L luminal, LNCaP, C4-2, CL1, DU145, PC3 cell lines, LuCaP35, LuCaP 49 xenografts. Except for DU145 and LuCaP 49, the expression pattern is either CD10 or AGR2.
Figure 8
Figure 8
LuCaP phenotypes. Staining results for six LuCaP xenografts and their AGR2/CD10 phenotypes are shown, magnification 40x. Where staining is absent a “−“ sign is used, or present a ”+” sign is used. “High” or “low” are used to indicate strong or weak staining.
Figure 9
Figure 9
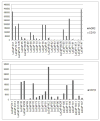
Expression levels of AGR2 and CD10 in xenografts. As inferred from DNA microarray analysis, these levels are presented in histogram format (top). CY3 intensity values are indicated on the y-axis. Because of the lower values for CD10, a separate histogram for CD10 is included (bottom). Note the ~6-fold decrease in CD10 from LuCaP 96 to LuCaP 96CR.
Figure 10
Figure 10
Castration resistant LuCaP xenografts. Staining between LuCaP 23.1 and LuCaP 23.1CR for AGR2, between LuCaP 96 and LuCaP 96CR for AGR2 and CD10 are shown, magnification 200x. Red arrows in the LuCaP23.1CR AGR2 panel show examples of weak cytoplasmic staining of tumor cells. The white arrow in the LuCaP 96CR AGR2 panel shows intercellular AGR2 reactivity. Note the overall decreased CD10 staining in the LuCaP 96CR CD10 panel than in the LuCaP 96 CD10 panel.

References

    1. Thompson IM, Pauler DK, Goodman PJ, et al. Prevalence of prostate cancer among men with a prostate-specific antigen level < or =4.0 ng per milliliter. N Eng J Med. 2004;350:2239–2246. - PubMed
    1. Yu JB, Makarov DV, Sharma R, et al. Validation of the Partin nomogram for prostate cancer in a national sample. J Urol. 2010;183:105–111. - PubMed
    1. Zhang JS, Gong A, Cheville JC, et al. AGR2, an androgen-inducible secretory protein overexpressed in prostate cancer. Genes Chromosomes Cancer. 2005;43:249–259. - PubMed
    1. Pascal LE, Vêncio RZN, Page LS, et al. Gene expression relationship between prostate cancer cells of Gleason 3, 4 and normal epithelial cells as revealed by cell type-specific transcriptomes. BMC Cancer. 2009;9:452. - PMC - PubMed
    1. Maresh EL, Mah V, Alavi M, et al. Differential expression of anterior gradient gene AGR2 in prostate cancer. BMC Cancer. 2010;10:680. - PMC - PubMed

Publication types

MeSH terms