Exercise-induced pulmonary hypertension: physiological basis and methodological concerns
- PMID: 23348976
- PMCID: PMC3733438
- DOI: 10.1164/rccm.201211-2090CI
Exercise-induced pulmonary hypertension: physiological basis and methodological concerns
Abstract
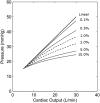
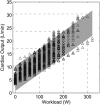
Exercise stresses the pulmonary circulation through increases in cardiac output (.Q) and left atrial pressure. Invasive as well as noninvasive studies in healthy volunteers show that the slope of mean pulmonary artery pressure (mPAP)-flow relationships ranges from 0.5 to 3 mm Hg.min.L(-1). The upper limit of normal mPAP at exercise thus approximates 30 mm Hg at a .Q of less than 10 L.min(-1) or a total pulmonary vascular resistance at exercise of less than 3 Wood units. Left atrial pressure increases at exercise with an average upstream transmission to PAP in a close to one-for-one mm Hg fashion. Multipoint PAP-flow relationships are usually described by a linear approximation, but present with a slight curvilinearity, which is explained by resistive vessel distensibility. When mPAP is expressed as a function of oxygen uptake or workload, plateau patterns may be observed in patients with systolic heart failure who cannot further increase .Q at the highest levels of exercise. Exercise has to be dynamic to avoid the increase in systemic vascular resistance and abrupt changes in intrathoracic pressure that occur with resistive exercise and can lead to unpredictable effects on the pulmonary circulation. Postexercise measurements are unreliable because of the rapid return of pulmonary vascular pressures and flows to the baseline resting state. Recent studies suggest that exercise-induced increase in PAP to a mean higher than 30 mm Hg may be associated with dyspnea-fatigue symptomatology.
Figures


References
-
- Cournand A, Bloomfield RA, Lauson HD. Double lumen catheter for intravenous and intracardiac blood sampling and pressure recording. Proc Soc Exp Biol Med 1945;60:73–75 - PubMed
-
- Fishman AP. Pulmonary circulation. In: American Physiology Society handbook of physiology: section 3. The respiratory system. Circulation and nonrespiratory functions. Vol 1. Bethesda MD: American Physiology Society; 1985. pp. 93–166.
-
- Rich S, Dantzker DR, Ayres SM, Bergofsky EH, Brundage BH, Detre KM, Fishman AP, Goldring RM, Groves BM, Koerner SK. Primary pulmonary hypertension. A national prospective study. Ann Intern Med 1987;107:216–223 - PubMed
-
- Badesch DB, Champion HC, Sanchez MA, Hoeper MM, Loyd JE, Manes A, McGoon M, Naeije R, Olschewski H, Oudiz RJ, et al. Diagnosis and assessment of pulmonary arterial hypertension. J Am Coll Cardiol 2009;54:S55–S66 - PubMed
Publication types
MeSH terms
Grants and funding
LinkOut - more resources
Full Text Sources
Other Literature Sources
Medical
Research Materials
Miscellaneous

