. 2013 Mar 14;121(11):2099-107.
doi: 10.1182/blood-2012-07-441188. Epub 2013 Jan 24.

Erythrocyte NADPH oxidase activity modulated by Rac GTPases, PKC, and plasma cytokines contributes to oxidative stress in sickle cell disease

Affiliations

Erythrocyte NADPH oxidase activity modulated by Rac GTPases, PKC, and plasma cytokines contributes to oxidative stress in sickle cell disease

Alex George et al. Blood. .

Erratum in

  • Blood. 2014 Mar 20;123(12):1972

Abstract

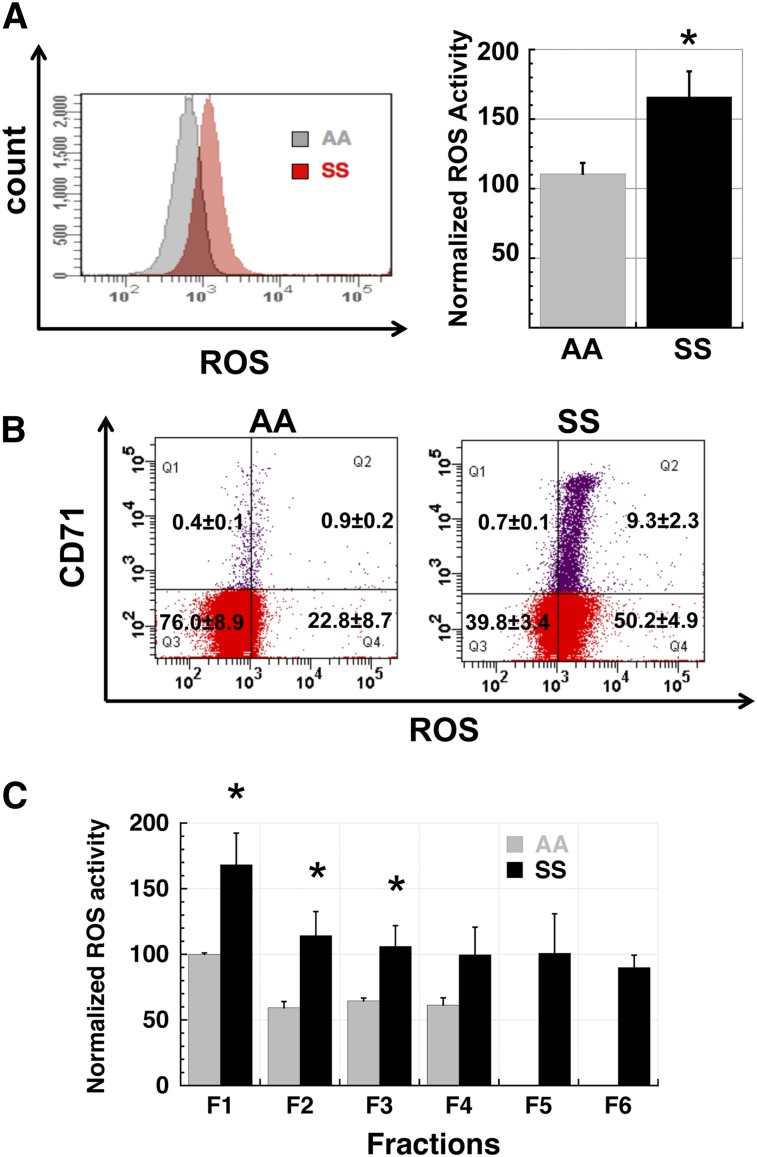
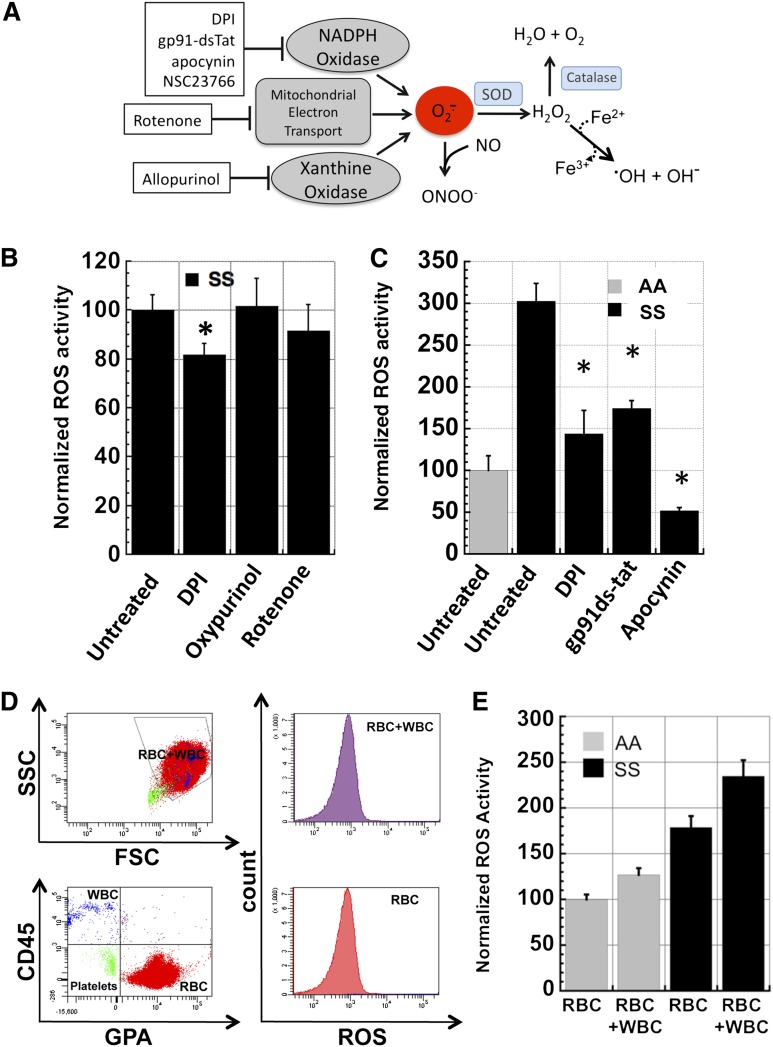
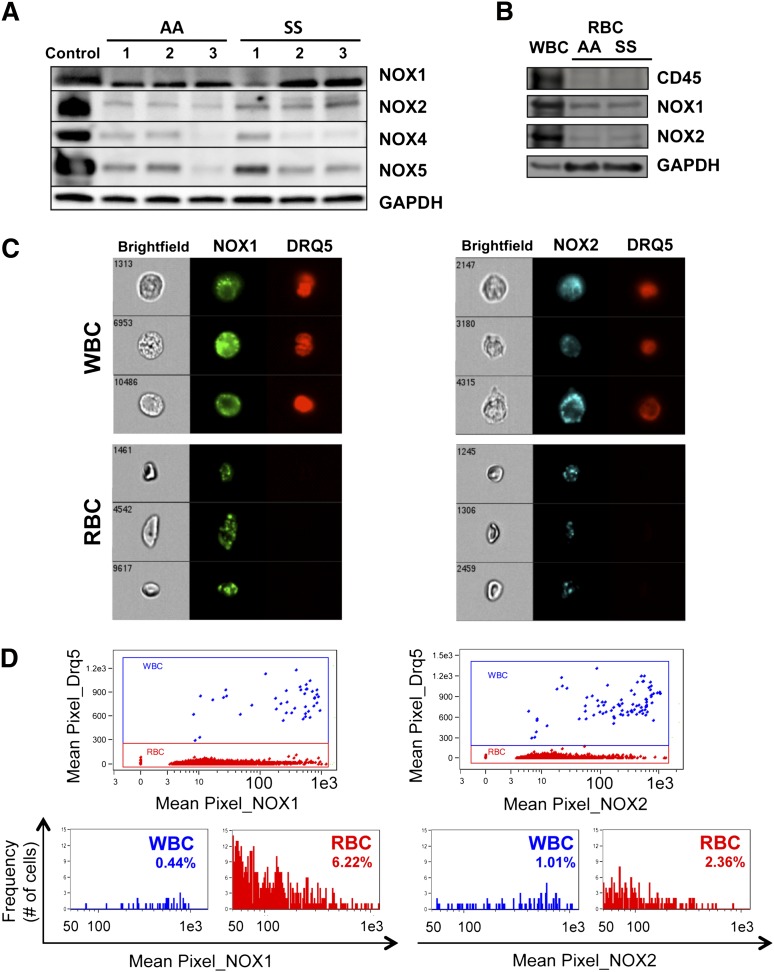
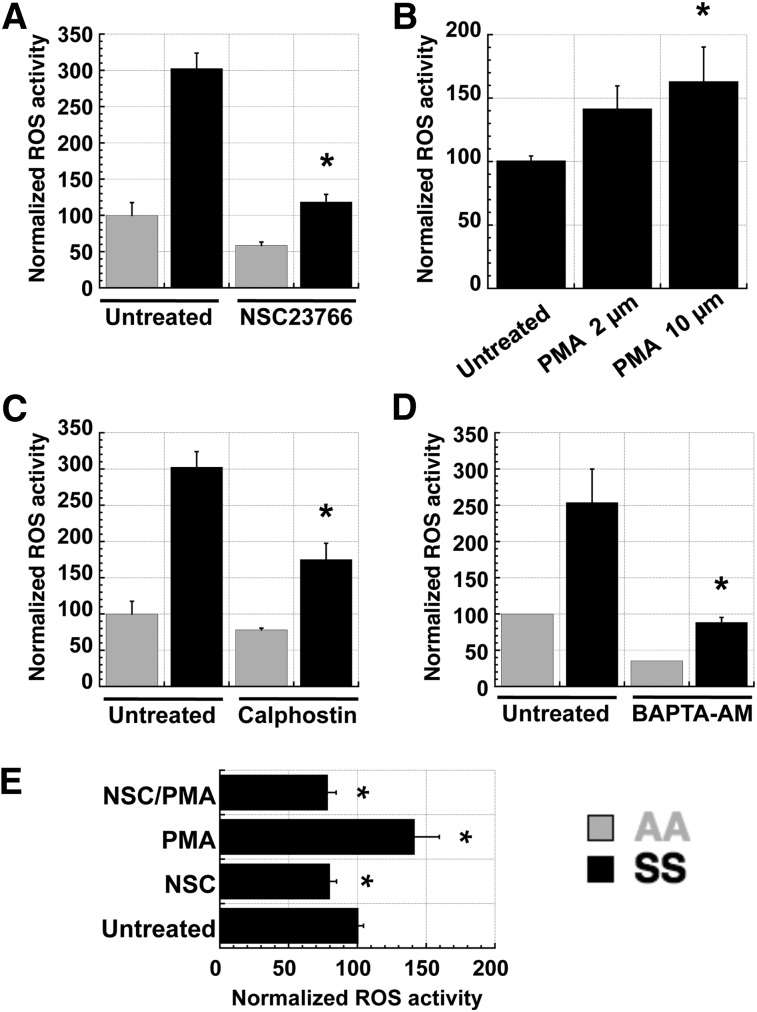
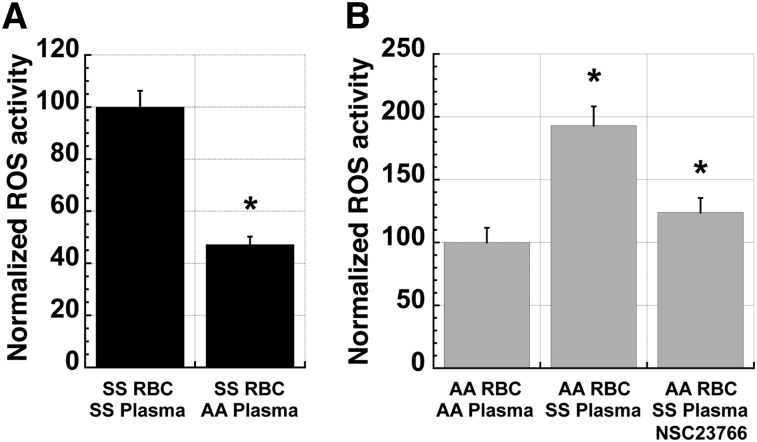
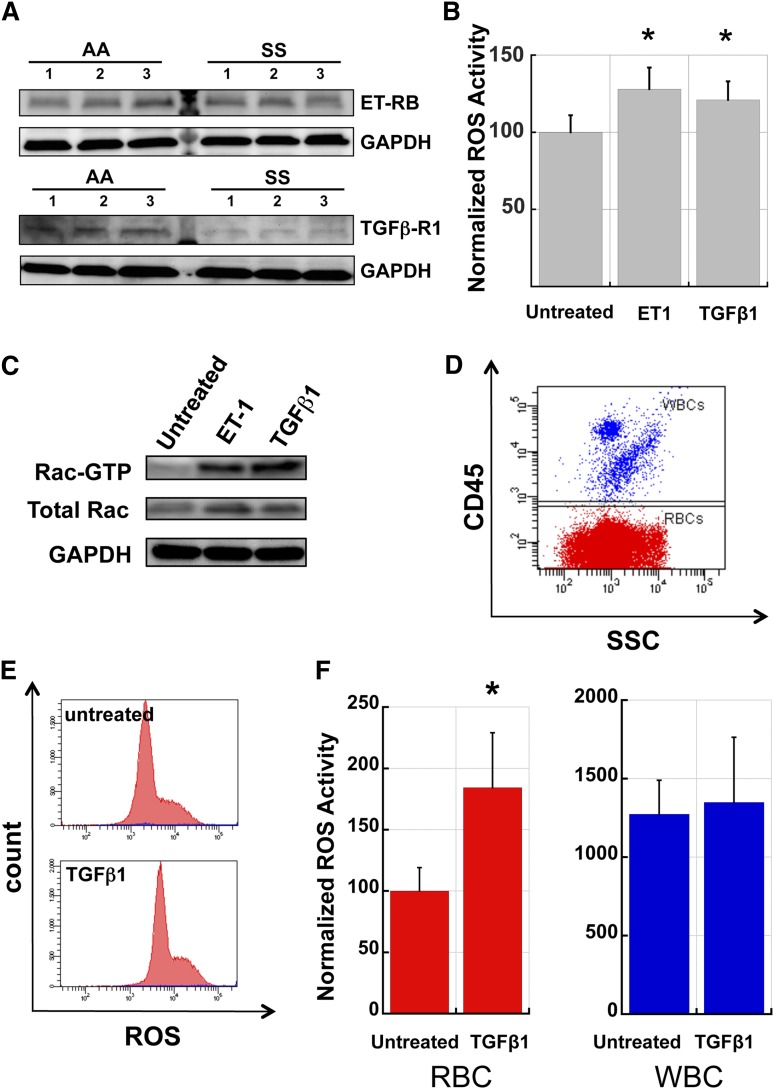
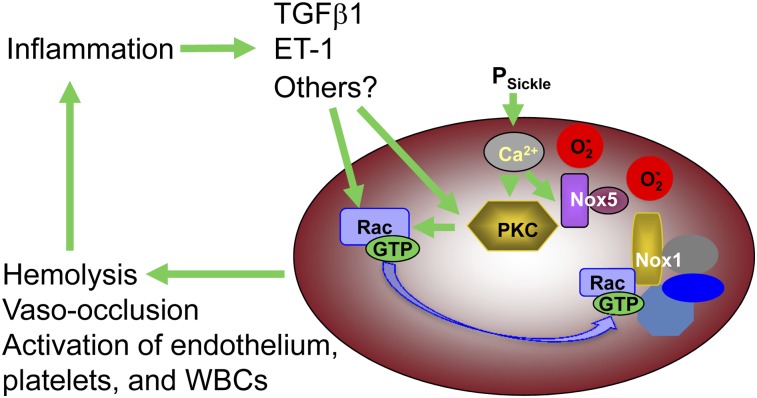
Chronic inflammation has emerged as an important pathogenic mechanism in sickle cell disease (SCD). One component of this inflammatory response is oxidant stress mediated by reactive oxygen species (ROS) generated by leukocytes, endothelial cells, plasma enzymes, and sickle red blood cells (RBC). Sickle RBC ROS generation has been attributed to sickle hemoglobin auto-oxidation and Fenton chemistry reactions catalyzed by denatured heme moieties bound to the RBC membrane. In this study, we demonstrate that a significant part of ROS production in sickle cells is mediated enzymatically by NADPH oxidase, which is regulated by protein kinase C, Rac GTPase, and intracellular Ca(2+) signaling within the sickle RBC. Moreover, plasma from patients with SCD and isolated cytokines, such as transforming growth factor β1 and endothelin-1, enhance RBC NADPH oxidase activity and increase ROS generation. ROS-mediated damage to RBC membrane components is known to contribute to erythrocyte rigidity and fragility in SCD. Erythrocyte ROS generation, hemolysis, vaso-occlusion, and the inflammatory response to tissue damage may therefore act in a positive-feedback loop to drive the pathophysiology of sickle cell disease. These findings suggest a novel pathogenic mechanism in SCD and may offer new therapeutic targets to counteract inflammation and RBC rigidity and fragility in SCD.


Figures

Figure 1
Figure 1
Production of reactive oxygen species is elevated in SS RBC. (A) Comparison of ROS levels in total populations of AA and SS RBC. SS RBC manifest a 1.5- to 2.5-fold higher signal than AA RBC by flow cytometric measurement of CM-H2-DCFDA-derived signal (P < .05). The left panel shows fluorescence histograms of representative AA and SS samples while the right panel shows normalized MFI data of AA (n = 3) and SS samples (n = 5). (B) Elevated ROS production in SS RBC is not confined to the reticulocyte subpopulation. Total AA and SS RBC samples were simultaneously stained for ROS levels with CM-H2-DCFDA and for the reticulocyte marker CD71. While SS reticulocytes have a higher average signal than non-reticulocyte SS RBC (right panel), the whole population of non-reticulocyte SS RBC demonstrates a right shift relative to AA non-reticulocyte RBC (left panel). Flow cytograms are representative of 3 AA and 3 SS samples. (C) Elevated ROS production in SS RBC relative to AA RBC is preserved across all fractions (F1 - F6) of density-fractionated erythrocytes. Fractions 5 and 6 cells represent sickle “dense cells” and are not typically found in AA samples. n = 3 AA and 3 SS samples and P < .05 where designated by asterisks.
Figure 2
Figure 2
Production of ROS in SS RBC is mediated in part by NADPH oxidase activity. (A) A schematic depiction of ROS metabolism along with inhibitors of enzymatic sources of ROS. (B) The ROS signal in SS RBC is reduced by preincubation with the NADPH oxidase inhibitor DPI (10 μM) prior to staining with CM-H2-DCFDA, but not by the xanthine oxidase inhibitor oxypurinol (500 µM) or the mitochondrial electron transport inhibitor rotenone (50 µM) (n = 6). (C) The ROS signal in SS RBC is reduced by preincubation with any of the known inhibitors of NADPH oxidase (DPI at 50 µM, gp91-dsTat at 50 µM, and apocynin at 100 µM), supporting the involvement of NADPH oxidase in ROS generation in these cells (n = 3 and P < .05 where designated by asterisks). (D) Whole-blood samples from AA and SS subjects were colabeled with PE-Cy7 anti-CD45, PE–anti-GPA, and CM-H2-DCFDA to permit the identification of WBC (CD45+;GPA) and RBC (CD45;GPA+) populations and the quantitation of the total ROS signal from each population (shown in the histograms as red for the RBC population, blue [thin line along the x-axis] for WBC and purple for the total RBC + WBC populations, in representative samples). (E) RBC ROS production, identified by gating out the CD45+ WBC population, constituted almost 80% of the combined RBC and WBC ROS signal. In AA samples (n = 10), the signal from RBC alone was 79% ± 1.5% of the total signal, whereas in SS samples (n = 7) this proportion was 77% ± 4.7%. FSC, forward light scatter; SSC, side light scatter.
Figure 3
Figure 3
AA and SS RBC contain several NOX isoforms. (A) NOX isoforms are detectable in AA and SS RBC. Western blotting of total RBC lysates reveals the presence of the NOX isoforms NOX1, NOX2 (gp91), NOX4, and NOX5 in both AA and SS RBC. NOX3 could not be detected. Control samples for the different NOX isoforms were human WBC lysate (NOX1 and NOX2), human kidney lysate (NOX4), and human testis lysate (NOX5). (B) NOX1 and NOX2, but not CD45, are detected in AA and SS RBC, indicating that the presence of NOX isoforms in the RBC lysate is not due to WBC contamination. (C) NOX1 and NOX2 are detected by immunofluorescence in intact WBC, as expected, as well as in intact RBC of whole SS blood samples, by multiparameter high-speed cell imaging in flow. (D) Up to 80% of sickle RBC have positive stain for NOX1, with 6% of the erythrocytes having a mean pixel value (expressing the MFI) of NOX1 >50 (arbitrary units), at the level of positivity for NOX1 in WBC within the same sample. NOX2 positivity appear less intense for the sickle erythrocytes in comparison with WBC, with only 2% of the RBC staining as strongly positive as the WBC.
Figure 4
Figure 4
ROS production in SS RBC is mediated by a PKC–RacGTP signaling axis. Fraction 1 SS or AA RBC were preincubated with inhibitors or inducers for 1 hour prior to staining with CM-H2-DCFDA. (A) ROS levels in SS RBC are decreased by preincubation with the Rac-specific small-molecule inhibitor NSC23766 (NSC), indicating that Rac-GTP mediates ROS production in erythrocytes. (B,C) ROS levels in SS RBC are (B) increased by preincubation with the PKC activator PMA and (C) decreased by the PKC inhibitor calphostin (500 nM), indicating that PKC activity increases ROS production in erythrocytes. (D) ROS levels in SS RBC are decreased by preincubation with the cell-permeable calcium chelator BAPTA-AM (50 µM), indicating that free calcium, a key activator of classic PKC isoforms, is necessary for ROS generation in erythrocytes. (E) Fraction 1 SS RBC were incubated with 500 µM NSC23766 (NSC), 2 µM PMA (PMA), or both (NSC/PMA) for 1 hour before staining with CM-H2-DCFDA to detect ROS levels. Inhibition of Rac-GTP activity with NSC23766 blocks the PKC-mediated induction of ROS production in SS RBC, indicating that Rac-GTP acts downstream of PKC in the activation of NADPH oxidase in erythrocytes. Data presented are representative of repeated experiments with batched samples. n = 4 each for AA and SS samples in all graphs above, and P < .05 where designated by asterisks.
Figure 5
Figure 5
Sickle plasma activates ROS production in erythrocytes in a manner dependent on Rac-GTPase activity. (A) ROS production in fraction 1 SS RBC decreases significantly with incubation in ABO-matched AA plasma when compared with RBC incubated in endogenous or exogenous ABO-matched SS plasma. Cells were incubated for 24 hours in a standard tissue-culture incubator at 37°C before incubating with CM-H2-DCFDA for ROS quantitation. n = 20 and P < .05. (B) ROS production in fraction 1 AA RBC increases significantly with incubation in ABO-matched SS plasma compared with RBC incubated in endogenous or exogenous ABO-matched AA plasma. This induction is partially blocked by coincubation with NSC23766 (500 µM). Cells were incubated for 4 hours in a standard tissue-culture incubator before staining with CM-H2-DCFDA. n = 17 and P < .05.
Figure 6
Figure 6
TGFβ1 and Endothelin-1 activate Rac-GTP and stimulate ROS production in AA RBC. (A) AA and SS RBC carry surface receptors to TGFβ1 and ET-1. RBC membrane preparations (pink ghosts) were probed with antibodies against ET-1 Receptor B or TGFβ1 Receptor type 1 as indicated. GAPDH at the same specimen is shown as loading control. (B) Fraction 1 RBC from healthy (AA) donors were incubated for 4 hours in endogenous plasma with or without the addition of exogenous ET-1 (2.5 µM) or TGFβ1 (0.5 µg/ml) and then stained for ROS with CM-H2-DCFDA. n = 15 and P < .05. (C) Fraction 1 AA RBC were incubated with ET-1 or TGFβ-1 as in (B) and then lysed and processed in pull-down assays to determine active Rac (Rac-GTP). Control aliquots of total lysate were immunoblotted for total Rac and GAPDH proteins as quantitative controls for pull-down and loading. The experiment was repeated three times with similar results. (D) Representative flow cytogram demonstrating the CD45 positive WBC mixed with fraction 1 AA RBC (CD45-negative), in order to evaluate relative erythrocyte and leukocyte ROS production. (E) Representative histograms of AA RBC (red) and WBC (blue population along the x-axis) samples without and with TGFβ1 stimulation. (F) Comparative ROS signals and induction of ROS production in AA RBC and WBC by TGFβ-1 stimulation. All ROS signals are normalized to the unstimulated RBC signal. TGFβ1 caused an increase of 84% in RBC ROS production (P < .05) while it only caused a 6% increase in WBC ROS production (n = 5). SSC, side light scatter.
Figure 7
Figure 7
Proposed model for the contribution by erythrocyte-derived ROS to SCD pathophysiology. Erythrocyte NADPH oxidase-derived ROS, along with that derived from HbS auto-oxidation, induces structural damage in the RBC that renders the cell more vulnerable to lysis or sickling deformation and vaso-occlusion. Additionally, ROS escaping from the RBC effect changes in plasma proteins, WBC, endothelial cells, and platelets, which in conjunction with RBC lysis and vaso-occlusion induce a state of chronic systemic inflammation. Extracellular signaling molecules associated with this inflammatory state act back on the RBC, via cell surface receptors, to induce higher levels of NADPH oxidase activity, closing a positive-feedback loop that drives hemolysis, irreversible sickling, and vaso-occlusion.

References

    1. Hebbel RP, Vercellotti G, Nath KA. A systems biology consideration of the vasculopathy of sickle cell anemia: the need for multi-modality chemo-prophylaxsis. Cardiovasc Hematol Disord Drug Targets. 2009;9(4):271–292. - PMC - PubMed
    1. Nur E, Biemond BJ, Otten HM, et al. CURAMA Study Group. Oxidative stress in sickle cell disease; pathophysiology and potential implications for disease management. Am J Hematol. 2011;86(6):484–489. - PubMed
    1. Ray D, Deshmukh P, Goswami K, et al. Antioxidant vitamin levels in sickle cell disorders. Natl Med J India. 2007;20(1):11–13. - PubMed
    1. Hasanato RM. Zinc and antioxidant vitamin deficiency in patients with severe sickle cell anemia. Ann Saudi Med. 2006;26(1):17–21. - PMC - PubMed
    1. Ren H, Ghebremeskel K, Okpala I, et al. Patients with sickle cell disease have reduced blood antioxidant protection. Int J Vitam Nutr Res. 2008;78(3):139–147. - PubMed

Publication types

MeSH terms