

The dynamic relationship between physical function and cognition in longitudinal aging cohorts
- PMID: 23349427
- PMCID: PMC3578448
- DOI: 10.1093/epirev/mxs004
The dynamic relationship between physical function and cognition in longitudinal aging cohorts
Abstract
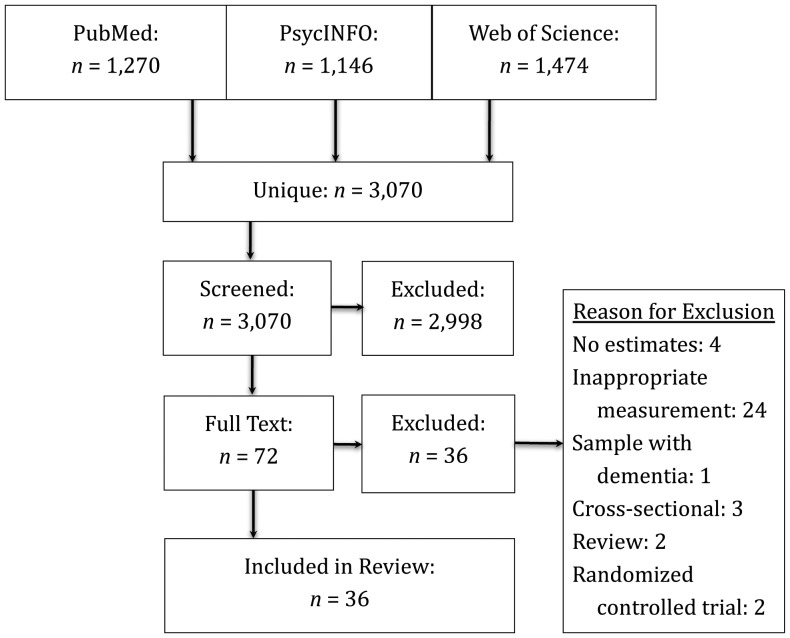
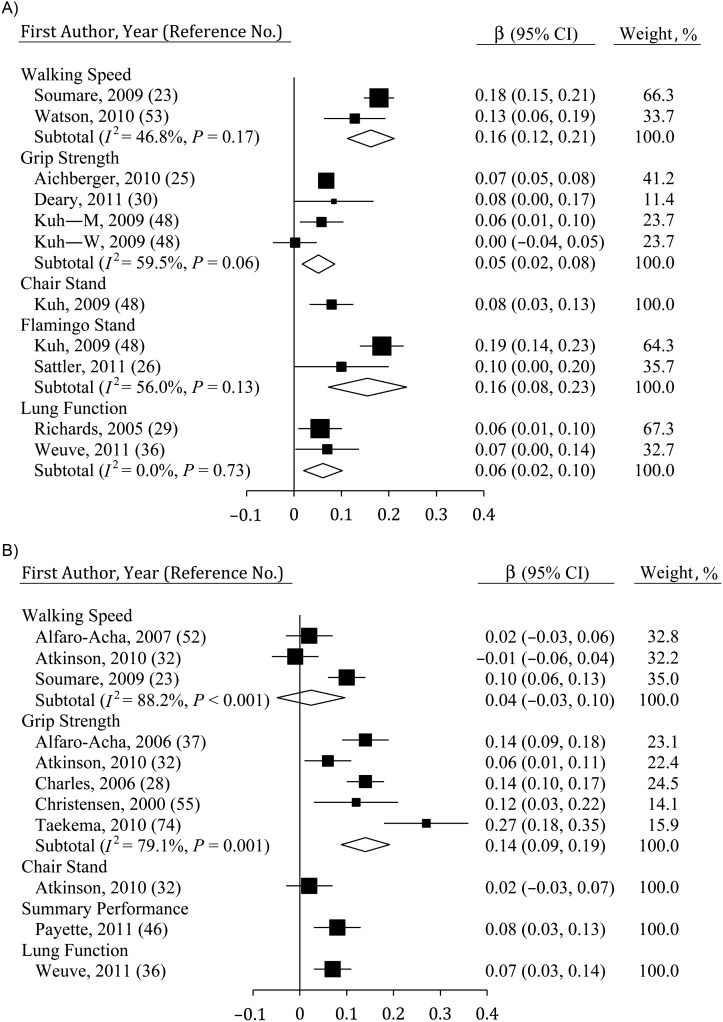
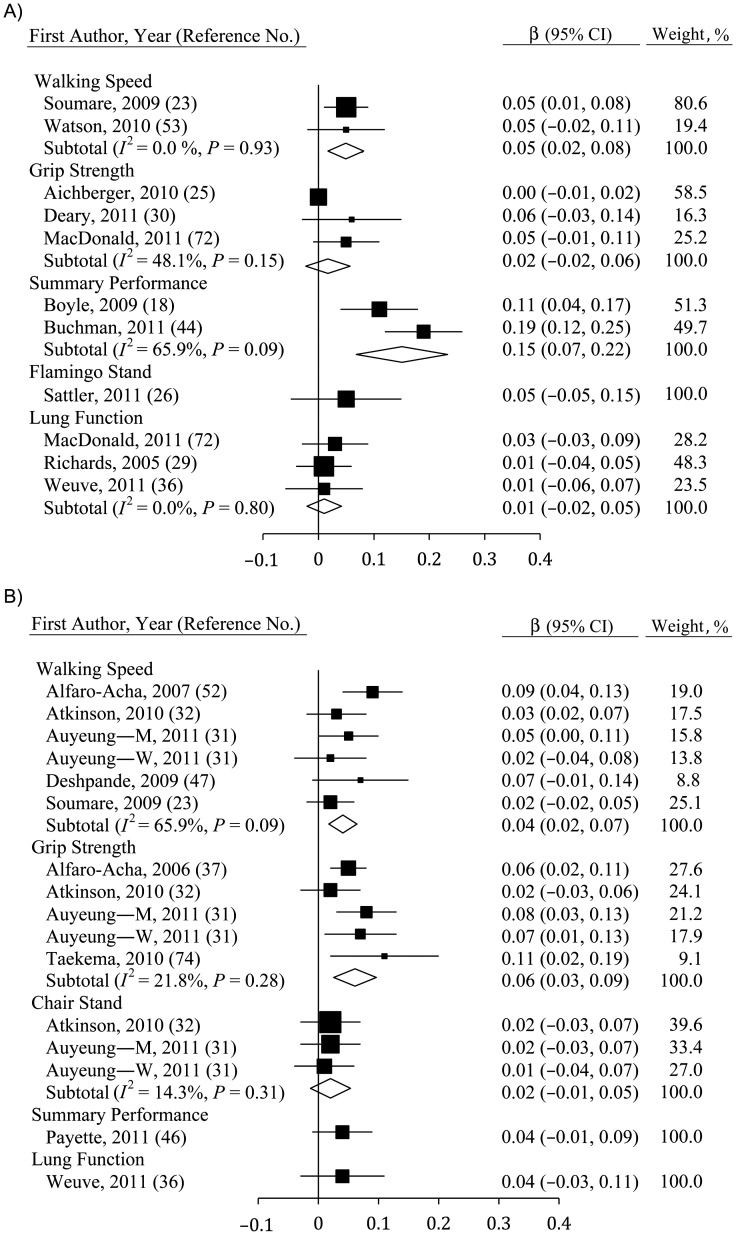
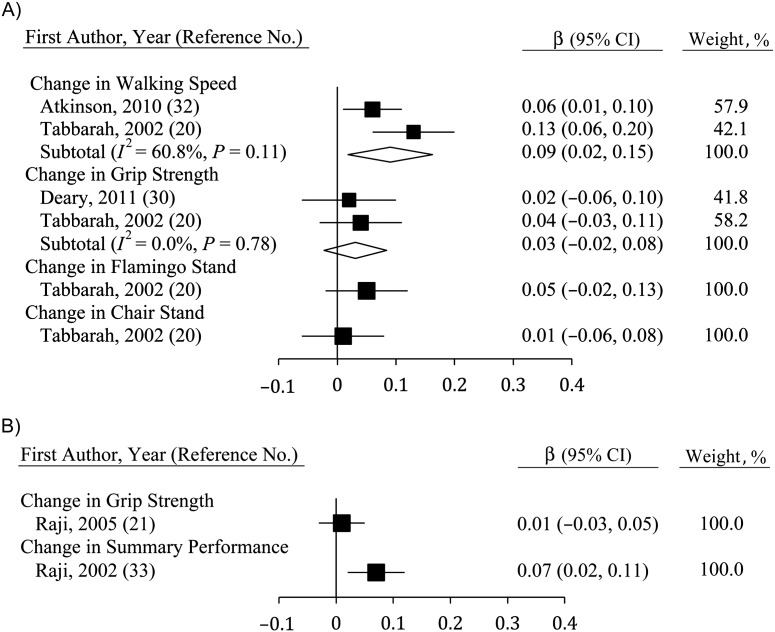
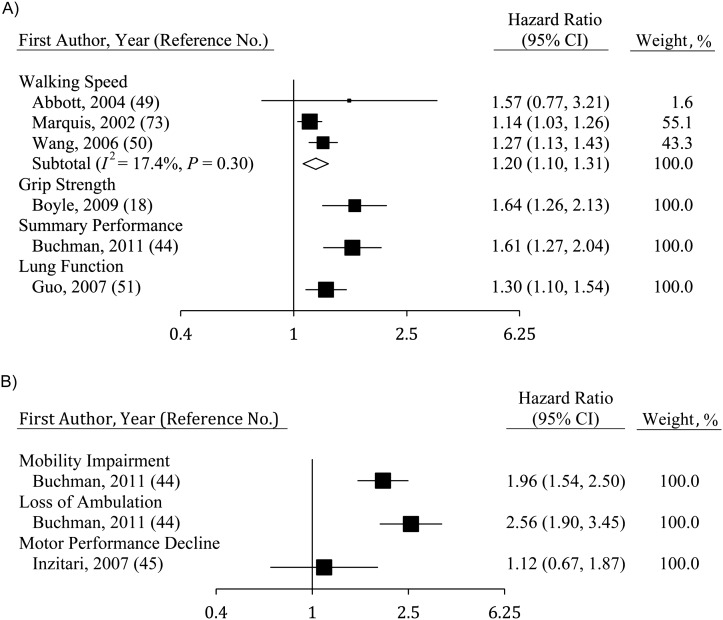
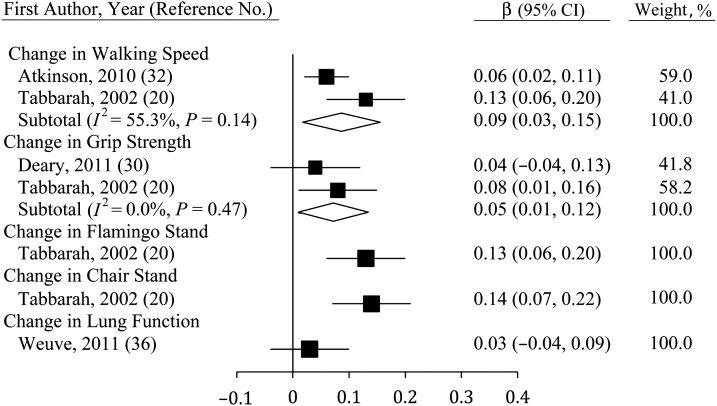
On average, older people remember less and walk more slowly than do younger persons. Some researchers argue that this is due in part to a common biologic process underlying age-related declines in both physical and cognitive functioning. Only recently have longitudinal data become available for analyzing this claim. We conducted a systematic review of English-language research published between 2000 and 2011 to evaluate the relations between rates of change in physical and cognitive functioning in older cohorts. Physical functioning was assessed using objective measures: walking speed, grip strength, chair rise time, flamingo stand time, and summary measures of physical functioning. Cognition was measured using mental state examinations, fluid cognition, and diagnosis of impairment. Results depended on measurement type: Change in grip strength was more strongly correlated with mental state, while change in walking speed was more strongly correlated with change in fluid cognition. Examining physical and cognitive functioning can help clinicians and researchers to better identify individuals and groups that are aging differently and at different rates. In future research, investigators should consider the importance of identifying different patterns and rates of decline, examine relations between more diverse types of measures, and analyze the order in which age-related declines occur.
Keywords: aging; cognition; correlated change; longitudinal analysis; meta-analysis; physical functioning; systematic review.
© The Author 2013. Published by Oxford University Press on behalf of the Johns Hopkins Bloomberg School of Public Health.
Figures
References
-
- Singh-Manoux A, Kivimaki M, Glymour MM, et al. Timing of onset of cognitive decline: results from Whitehall II prospective cohort study. Br Med J. 2012;344(d7622):1–8. doi:10.1136/bmj.d7622. - DOI - PMC - PubMed
-
- Ismail Z, Rajji TK, Shulman KI. Brief cognitive screening instruments: an update. Int J Geriatr Psychiatry. 2010;25(2):111–120. - PubMed
-
- Cooper R, Hardy R, Sayer AA, et al. Age and gender differences in physical capability levels from mid-life onwards: the harmonisation and meta-analysis of data from eight UK cohort studies. PLoS One. 2011;6(11):1–14. doi:10.1371/journal.pone.0027899. - DOI - PMC - PubMed
-
- Blumenthal HT. The aging-disease dichotomy: true or false? J Gerontol A Biol Sci Med Sci. 2003;58(2):138–145. - PubMed
Publication types
MeSH terms
Grants and funding
LinkOut - more resources
Full Text Sources
Other Literature Sources
Medical
