

Series length used during trend analysis affects sensitivity to changes in progression rate in the ocular hypertension treatment study
- PMID: 23349433
- PMCID: PMC3597197
- DOI: 10.1167/iovs.12-10218
Series length used during trend analysis affects sensitivity to changes in progression rate in the ocular hypertension treatment study
Abstract
Purpose: Trend analysis techniques to detect glaucomatous progression typically assume a constant rate of change. This study uses data from the Ocular Hypertension Treatment Study to assess whether this assumption decreases sensitivity to changes in progression rate, by including earlier periods of stability.
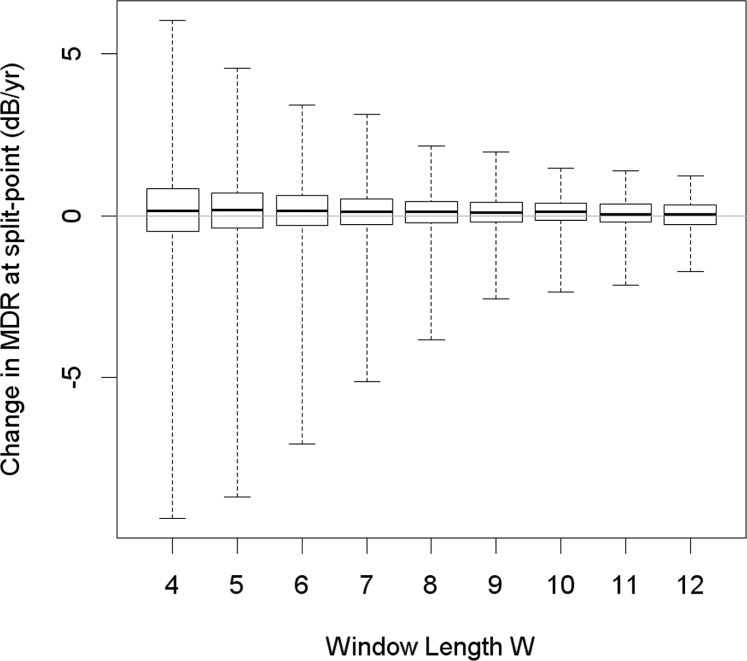
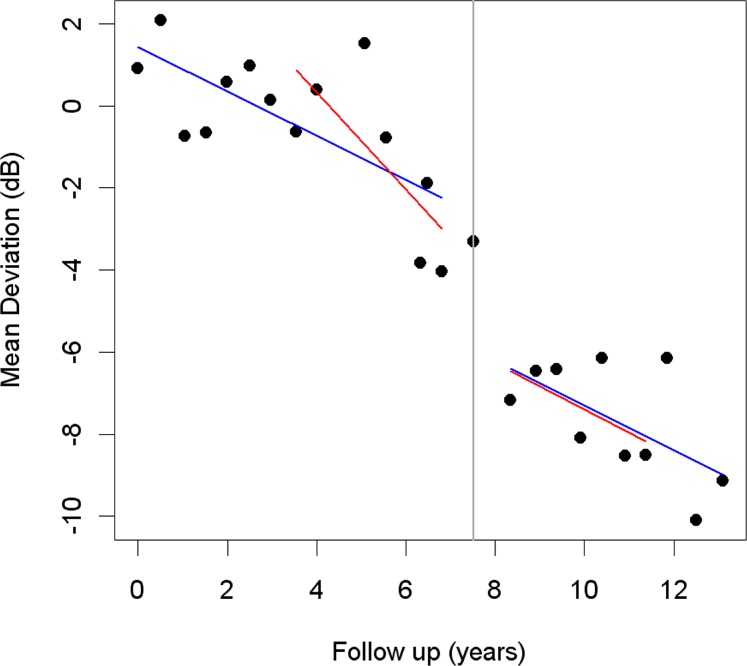
Methods: Series of visual fields (mean 24 per eye) completed at 6-month intervals from participants randomized initially to observation were split into subseries before and after the initiation of treatment (the "split-point"). The mean deviation rate of change (MDR) was derived using these entire subseries, and using only the window length (W) tests nearest the split-point, for different window lengths of W tests. A generalized estimating equation model was used to detect changes in MDR occurring at the split-point.
Results: Using shortened subseries with W = 7 tests, the MDR slowed by 0.142 dB/y upon initiation of treatment (P < 0.001), and the proportion of eyes showing "rapid deterioration" (MDR <-0.5 dB/y with P < 5%) decreased from 11.8% to 6.5% (P < 0.001). Using the entire sequence, no significant change in MDR was detected (P = 0.796), and there was no change in the proportion of eyes progressing (P = 0.084). Window lengths 6 ≤ W ≤ 9 produced similar benefits.
Conclusions: Event analysis revealed a beneficial treatment effect in this dataset. This effect was not detected by linear trend analysis applied to entire series, but was detected when using shorter subseries of length between six and nine fields. Using linear trend analysis on the entire field sequence may not be optimal for detecting and monitoring progression. Nonlinear analyses may be needed for long series of fields. (ClinicalTrials.gov number, NCT00000125.).
Conflict of interest statement
Disclosure:
Figures
References
-
- Gordon MO, Kass MA. for the Ocular Hypertension Treatment Study G. The Ocular Hypertension Treatment Study: design and baseline description of the participants. Arch Ophthalmol. 1999; 117: 573–583 - PubMed
-
- Kass M, Heuer D, Higginbotham E, et al. The ocular hypertension treatment study: a randomized trial determines that topical ocular hypotensive medication delays or prevents the onset of primary open-angle glaucoma. Arch Ophthalmol. 2002; 120: 701–713 - PubMed
-
- The Advanced Glaucoma Intervention Study Group The Advanced Glaucoma Intervention Study (AGIS): 1. Study design and methods and baseline characteristics of study patients. Control Clin Trials. 1994; 15: 299–325 - PubMed
-
- Leske M, Heijl A, Hyman L, Bengtsson B. Early manifest glaucoma trial – design and baseline data. Ophthalmology. 1999; 106: 2144–2153 - PubMed
Publication types
MeSH terms
Associated data
Grants and funding
LinkOut - more resources
Full Text Sources
Other Literature Sources
Medical
Miscellaneous
