Randomized Controlled Trial
. 2013 Jun;62(6):1843-54.
doi: 10.2337/db12-0868. Epub 2013 Jan 24.

Reduced adipose tissue macrophage content is associated with improved insulin sensitivity in thiazolidinedione-treated diabetic humans

Affiliations
Randomized Controlled Trial

Reduced adipose tissue macrophage content is associated with improved insulin sensitivity in thiazolidinedione-treated diabetic humans

Sudha Koppaka et al. Diabetes. 2013 Jun.

Abstract

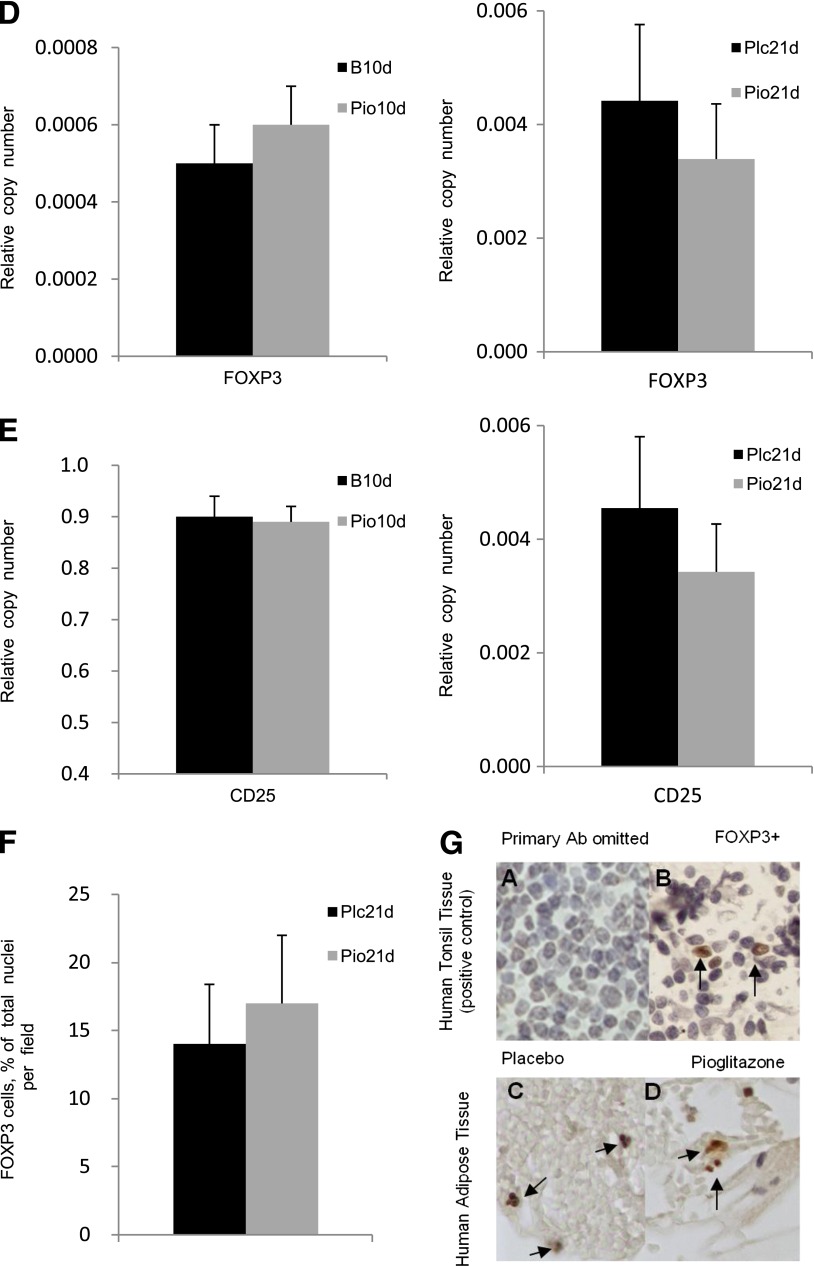
Obesity is associated with increased adipose tissue macrophage (ATM) infiltration, and rodent studies suggest that inflammatory factors produced by ATMs contribute to insulin resistance and type 2 diabetes. However, a relationship between ATM content and insulin resistance has not been clearly established in humans. Since thiazolidinediones attenuate adipose tissue inflammation and improve insulin sensitivity, we examined the temporal relationship of the effects of pioglitazone on these two parameters. The effect of 10 and 21 days of pioglitazone treatment on insulin sensitivity in 26 diabetic subjects was assessed by hyperinsulinemic-euglycemic clamp studies. Because chemoattractant factors, cytokines, and immune cells have been implicated in regulating the recruitment of ATMs, we studied their temporal relationship to changes in ATM content. Improved hepatic and peripheral insulin sensitivity was seen after 21 days of pioglitazone. We found early reductions in macrophage chemoattractant factors after only 10 days of pioglitazone, followed by a 69% reduction in ATM content at 21 days and reduced ATM activation at both time points. Although markers for dendritic cells and neutrophils were reduced at both time points, there were no significant changes in regulatory T cells. These results are consistent with an association between adipose macrophage content and systemic insulin resistance in humans.


Figures

FIG. 1.
FIG. 1.
A: Schematic depiction of “stepped clamp” protocol. Plasma glucose values were clamped at 90 mg/dL for the duration of each study. Glucose fluxes were measured by infusing tritiated glucose. Somatostatin was infused for the entirety of the clamp to inhibit pancreatic hormone secretion, with concomitant replacement of glucagon and growth hormone (GH). Basal insulin infusion rates (- - -) were established for the first 2 h, and rates were then increased by 20 mU/m2/min to reproduce 2 h of physiologic hyperinsulinemia, the “low insulin” step of the clamp (formula image). During the final 2 h of the clamp, the insulin infusion rate was increased by 150 mU/m2/min above basal, the “high insulin” step of the clamp (formula image). B: Glucose-specific activity (SA) (cpm/mg) during the steady state of “stepped clamp” shown after Plc21d vs. Pio21d.
FIG. 2.
FIG. 2.
EGP (A) and Rd of glucose (B) after Plc21d vs. Pio21d in response to low insulin (180–240 min) or high insulin (300–360 min) steps of the clamp. EGP (C) and Rd (D) at B10d and after Pio10d during last hour (120–180 min) of the clamp study. *P < 0.05.
FIG. 3.
FIG. 3.
Gene expression in whole adipose tissue of macrophage chemoattractant factors. A: MCP-1 expression in adipose tissue at B10d vs. after Pio10d (left panel) and after Plc21d vs. Pio21d (right panel). MCP-1 decreased by 30% (95% CI 16–44) after Pio21d. B: CCR2 expression in macrophages at B10d vs. after Pio10d (left panel) and after Plc21d vs. Pio21d (right panel). CCR2 decreased by 34% (95% CI 6–62) after Pio21d. C: Hyaluronan synthase expression in adipose tissue at B10d vs. after Pio10d (left panel) and after Plc21d vs. Pio21d (right panel). Hyaluronan expression decreased by 37% (95% CI 22–52) after Pio21d. D: Expression of the hyaluronan receptor CD44 in adipose tissue also decreased significantly after Pio10d and Pio21d, with a 42% decrease (95% CI 23–61) at 21 days (right panel). *P < 0.05; **P < 0.01.
FIG. 4.
FIG. 4.
A: FACS analysis of percentage of CD14+ cells in whole adipose tissue at B10d vs. after Pio10d (left panel) and after Pio21d vs. Plc21d (right panel). CD14+ cells decreased by 69% (95% CI 38–97). Gene expression in whole adipose tissue of CD14 (B) and CD68 (C) after Pio10d and Pio21d. At 10 days, no significant reductions in CD14 expression or CD68 expression were observed by FACS or by gene expression. At 21 days, a 28% reduction in CD14 expression (95% CI 20–37) and a 36% reduction (95% CI 24–37) in CD68 expression were observed. D and E: Quantification of CD14+ and CCR2+ cells in the SVF of subcutaneous adipose tissue from one diabetic subject by flow cytometry before and after Pio21d is shown. Fluorescein isothiocyanate–labeled CD14+ antibody and phycoerythrin-labeled CCR2+ antibody were used. Results were analyzed using FACSCalibur flow cytometer. *P < 0.05.
FIG. 5.
FIG. 5.
Percent change in cytokine gene expression in whole fat after 10 (A) and 21 (B) days of pioglitazone. Percent change in cytokine gene expression in ATM after 10 (C) and 21 (D) days of pioglitazone. *Significance by P < 0.05 or CI. Double-immunofluorescence stains for iNOS expression (red), CD68 (green), and iNOS and CD68 coexpression (yellow, merged panel) in a placebo-treated subject. E: Bottom panels show adipose tissue from a subject treated with pioglitazone for 21 days. Note reduced iNOS (red), CD68 (green), and iNOS/CD68 coexpression (overlay) after pioglitazone treatment. F: iNOS+ CD68 coexpression was significantly reduced in 21 day pioglitazone-treated group compared with placebo; *P = 0.03 (n = 5).
FIG. 5.
FIG. 5.
Percent change in cytokine gene expression in whole fat after 10 (A) and 21 (B) days of pioglitazone. Percent change in cytokine gene expression in ATM after 10 (C) and 21 (D) days of pioglitazone. *Significance by P < 0.05 or CI. Double-immunofluorescence stains for iNOS expression (red), CD68 (green), and iNOS and CD68 coexpression (yellow, merged panel) in a placebo-treated subject. E: Bottom panels show adipose tissue from a subject treated with pioglitazone for 21 days. Note reduced iNOS (red), CD68 (green), and iNOS/CD68 coexpression (overlay) after pioglitazone treatment. F: iNOS+ CD68 coexpression was significantly reduced in 21 day pioglitazone-treated group compared with placebo; *P = 0.03 (n = 5).
FIG. 6.
FIG. 6.
Gene expression in whole adipose tissue of DEC-205 (A, left and right panels) and DC-SIGN (B, left and right panels) at B10d vs. after Pio10d and after Plc21d vs. Pio21d (A and B, right panels). C: Gene expression in whole adipose tissue of myeloperoxidase (MPO-3) after Pio10d (left panel) and Pio21d (right panel). Gene expression in whole adipose tissue of FOXP3 and CD25 after Pio10d (D and E, left panels) and Pio21d (D and E, right panels). F: Percentage of total nuclei per field of FOXP3 cells in whole adipose tissue samples of Plc21d vs. Pio10d as assessed by IHC. G: Representative histological staining for FOXP3. The arrows in subpanels B, C, and D represent FOXP3+ cells. Arrows indicate FOXP3+ cells.
FIG. 6.
FIG. 6.
Gene expression in whole adipose tissue of DEC-205 (A, left and right panels) and DC-SIGN (B, left and right panels) at B10d vs. after Pio10d and after Plc21d vs. Pio21d (A and B, right panels). C: Gene expression in whole adipose tissue of myeloperoxidase (MPO-3) after Pio10d (left panel) and Pio21d (right panel). Gene expression in whole adipose tissue of FOXP3 and CD25 after Pio10d (D and E, left panels) and Pio21d (D and E, right panels). F: Percentage of total nuclei per field of FOXP3 cells in whole adipose tissue samples of Plc21d vs. Pio10d as assessed by IHC. G: Representative histological staining for FOXP3. The arrows in subpanels B, C, and D represent FOXP3+ cells. Arrows indicate FOXP3+ cells.

References

    1. Hedley AA, Ogden CL, Johnson CL, Carroll MD, Curtin LR, Flegal KM. Prevalence of overweight and obesity among US children, adolescents, and adults, 1999-2002. JAMA 2004;291:2847–2850 - PubMed
    1. Ogden CL, Carroll MD, Curtin LR, McDowell MA, Tabak CJ, Flegal KM. Prevalence of overweight and obesity in the United States, 1999-2004. JAMA 2006;295:1549–1555 - PubMed
    1. Shoelson SE, Herrero L, Naaz A. Obesity, inflammation, and insulin resistance. Gastroenterology 2007;132:2169–2180 - PubMed
    1. Makkonen J, Westerbacka J, Kolak M, et al. Increased expression of the macrophage markers and of 11beta-HSD-1 in subcutaneous adipose tissue, but not in cultured monocyte-derived macrophages, is associated with liver fat in human obesity. Int J Obes (Lond) 2007;31:1617–1625 - PubMed
    1. Weisberg SP, McCann D, Desai M, Rosenbaum M, Leibel RL, Ferrante AW., Jr Obesity is associated with macrophage accumulation in adipose tissue. J Clin Invest 2003;112:1796–1808 - PMC - PubMed

Publication types