. 2013 May;62(5):1634-45.
doi: 10.2337/db12-0848. Epub 2013 Jan 24.

β-Cells are not generated in pancreatic duct ligation-induced injury in adult mice

Affiliations

β-Cells are not generated in pancreatic duct ligation-induced injury in adult mice

Matthew M Rankin et al. Diabetes. 2013 May.

Abstract

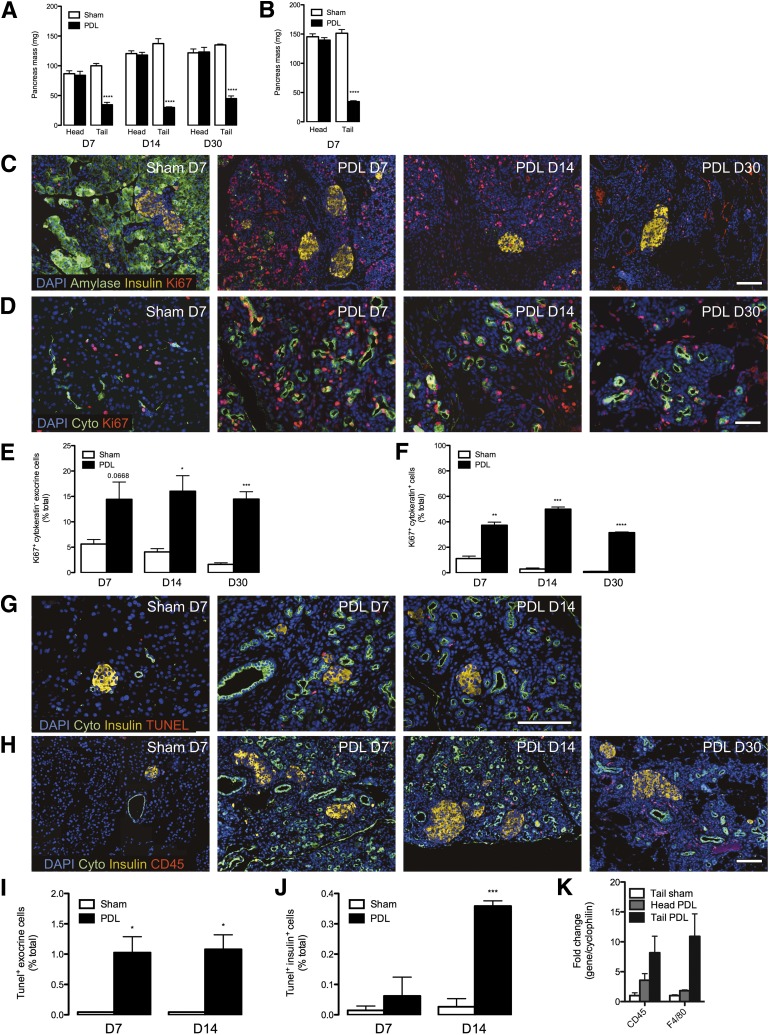
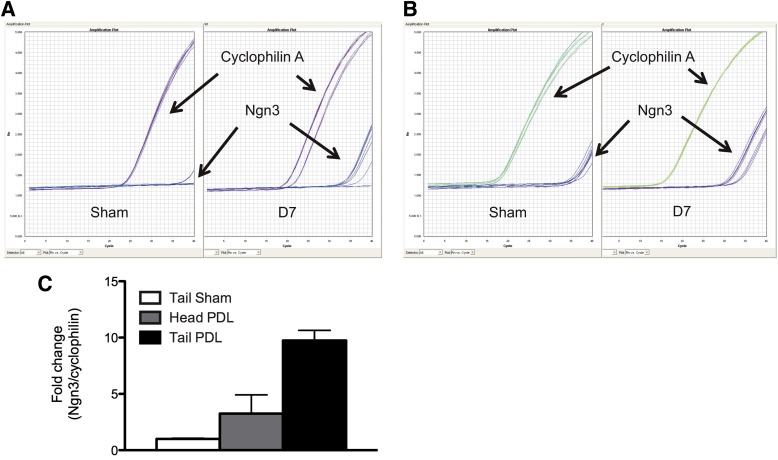
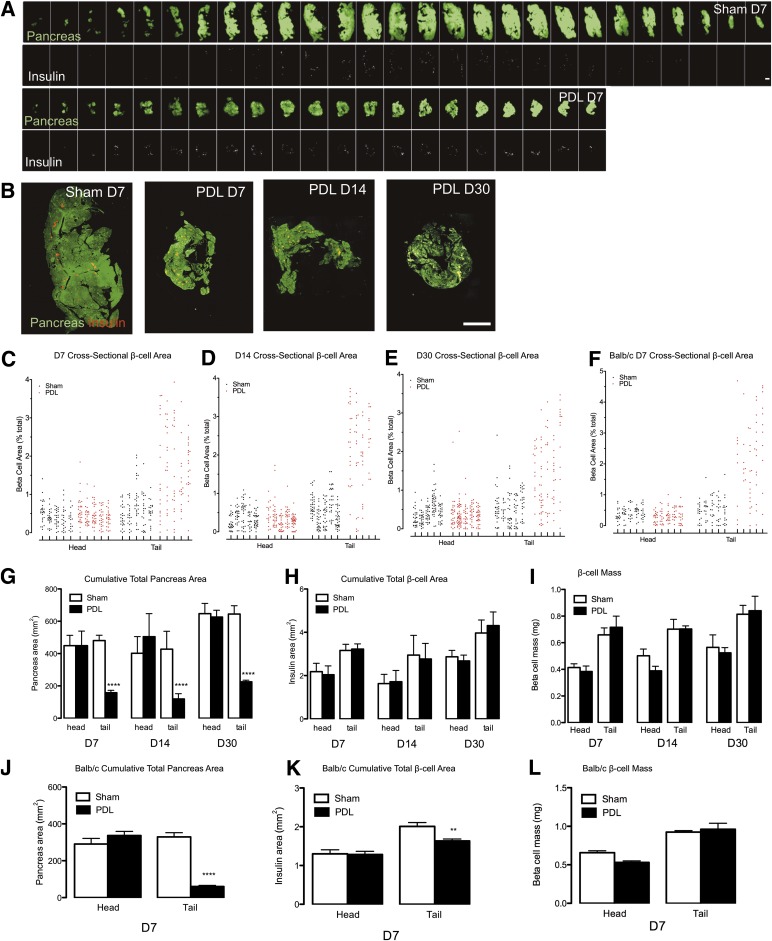
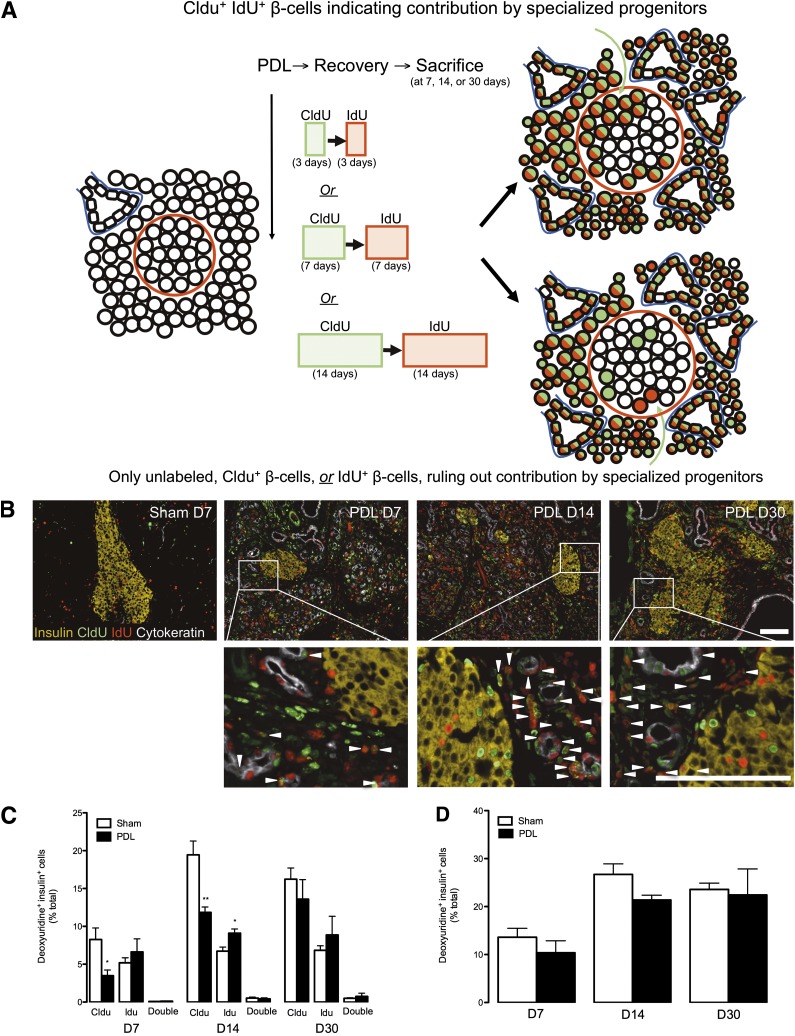
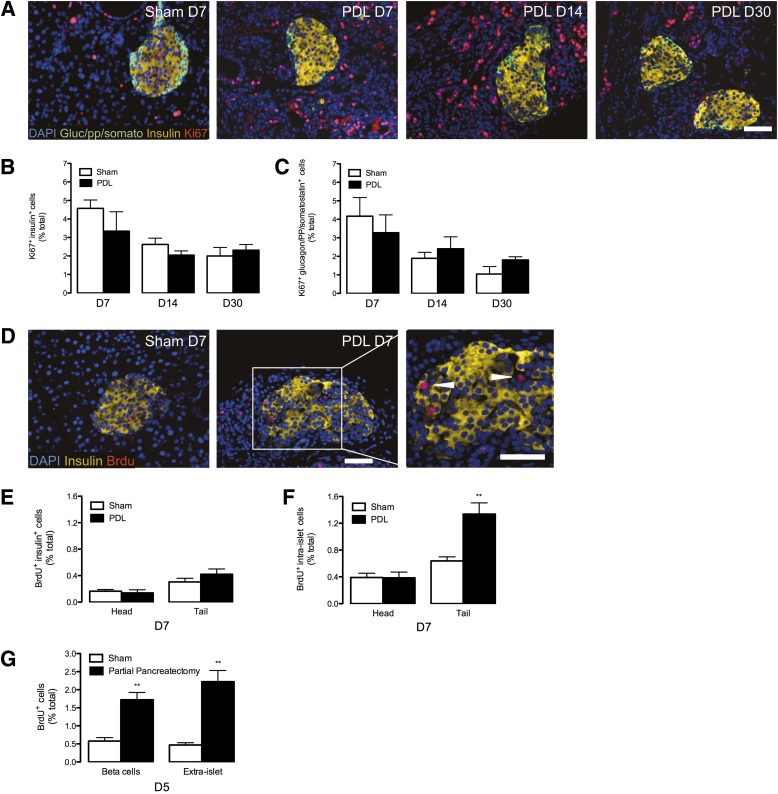
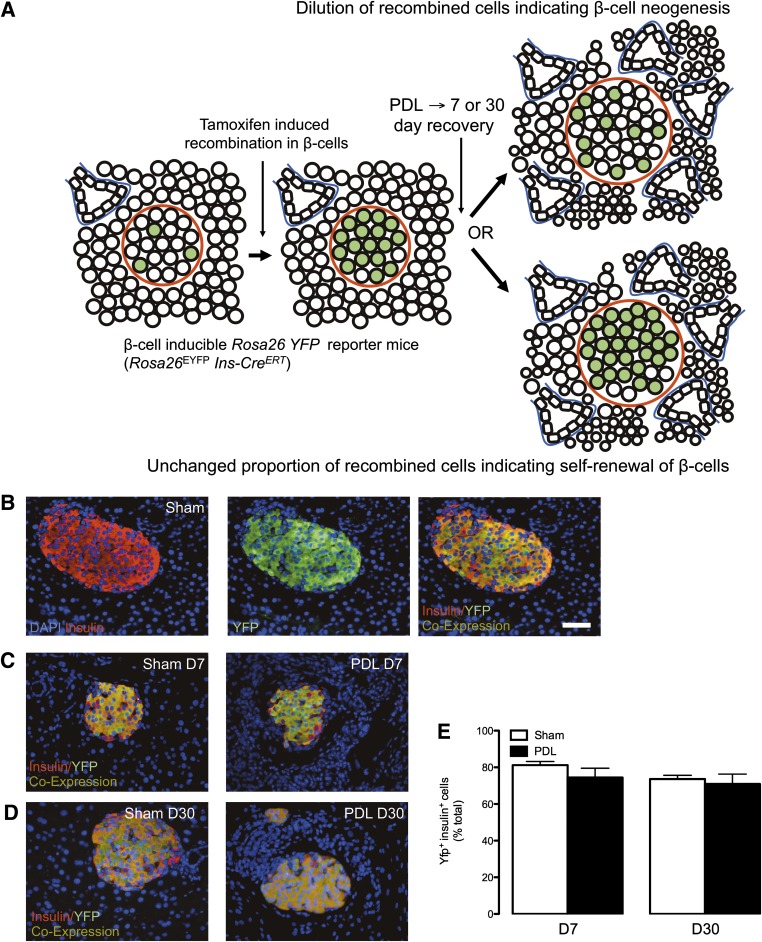
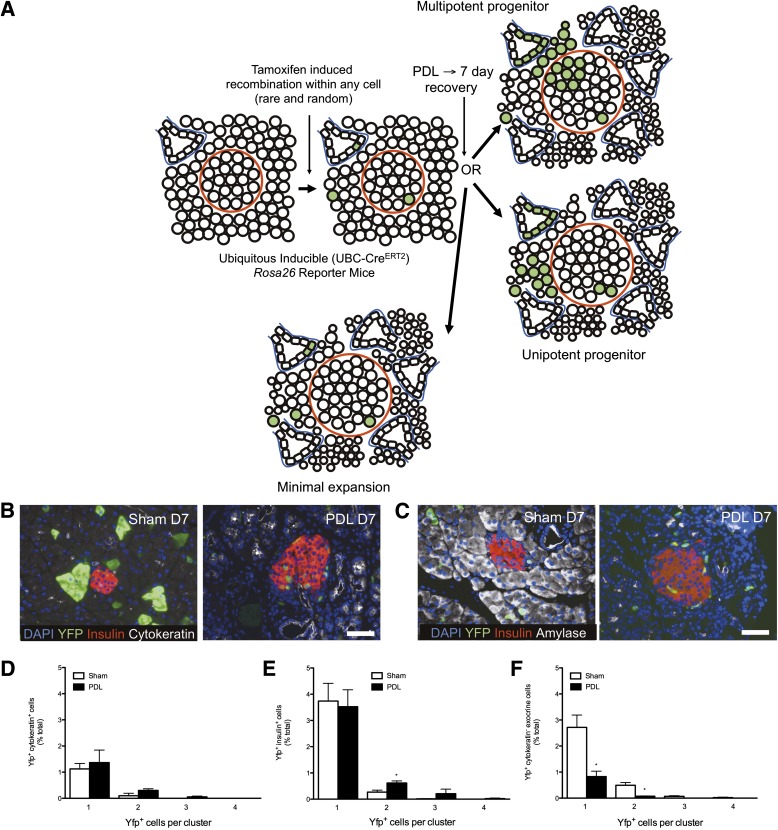
The existence of adult β-cell progenitors remains the most controversial developmental biology topic in diabetes research. It has been reported that β-cell progenitors can be activated by ductal ligation-induced injury of adult mouse pancreas and apparently act in a cell-autonomous manner to double the functional β-cell mass within a week by differentiation and proliferation. Here, we demonstrate that pancreatic duct ligation (PDL) does not activate progenitors to contribute to β-cell mass expansion. Rather, PDL stimulates massive pancreatic injury, which alters pancreatic composition and thus complicates accurate measurement of β-cell content via traditional morphometry methodologies that superficially sample the pancreas. To overcome this potential bias, we quantified β-cells from the entire pancreas and observed that β-cell mass and insulin content are totally unchanged by PDL-induced injury. Lineage-tracing studies using sequential administration of thymidine analogs, rat insulin 2 promoter-driven cre-lox, and low-frequency ubiquitous cre-lox reveal that PDL does not convert progenitors to the β-cell lineage. Thus, we conclude that β-cells are not generated in injured adult mouse pancreas.


Figures

FIG. 1.
FIG. 1.
Ligation of the main pancreatic duct induces stereotypic reorganization throughout the tail of the pancreas, with acinar apoptosis and ductal proliferation. The splenic branch of the pancreatic duct was ligated in 6- to 7-week-old mixed genetic background mice (F1 hybrid B6129SF1/J) and in 8-week-old Balb/c mice, leaving the head of the pancreas intact. A and B: Mass of the pancreatic tail is severely reduced by ductal ligation. Quantitative analysis of pancreas mass in mixed genetic background at 7, 14, and 30 days (A) and in Balb/c mice at 7 days (B). Data are means ± SEM; 3–5 animals per group. C: Pancreatic acinar tissue is replaced by highly proliferative cells after PDL injury. Images from 7-day sham-operated (control) and PDL tail pancreas. DAPI (blue), amylase (green), insulin (yellow), and ki67 (red). D: PDL induces highly proliferative duct cells. DAPI (blue), pancytokeratin (green), and ki67 (red). E: Quantitative analysis of extraislet nonduct proliferation (ki67+ cytokeratin exocrine cells) from sham-operated and PDL tail pancreas. F: Quantitative analysis of ductal proliferation (ki67+ pancytokeratin+ cells) from sham-operated and PDL tail pancreas. G: PDL induces massive death of cells within the exocrine pancreas. Images from sham-operated (control) and PDL tail pancreas. DAPI (blue), pancytokeratin (green), insulin (yellow), and TUNEL (red). H: PDL recruits lymphocytes (CD45+) to the pancreas. Images from sham-operated (control) and PDL tail pancreas. DAPI (blue), pancytokeratin (green), insulin (yellow), and CD45 (red). I: Quantitative analysis of extraislet death (TUNEL+ cells) from sham-operated and PDL tail pancreas. J: Quantitative analysis of intraislet death (TUNEL+ insulin+ cells) from sham-operated and PDL tail pancreas. K: PDL recruits cells with markers of lymphocytes (CD45+ cells) and macrophages (F4/80+ cells) to the pancreas. Gene expression analysis of total RNA from sham-operated and PDL pancreas at day 7. Scale bars: 100 μm. *P < 0.05, **P < 0.01, ***P < 0.001, ****P < 0.0001, ligated vs. unligated pancreas tail. D, day.
FIG. 2.
FIG. 2.
Ngn3 expression is induced in PDL-injured pancreas. A and B: Concentrated cDNA samples are necessary to accurately and consistently amplify Ngn3 transcript in sham pancreas samples using quantitative real-time PCR. A: Representative quantitative PCR curves from samples with traditional (smaller) quantities of pancreatic cDNA input from PDL samples (right panel) or sham-operated control tail samples (left panel) to amplify Ngn3 or cyclophilin A. B: Representative quantitative PCR curves from samples with revised (larger) quantities of pancreatic cDNA input from PDL samples (right panel) or sham-operated control tail samples (left panel) to amplify Ngn3 or cyclophilin A. C: Gene expression analysis of total RNA from sham or PDL pancreas at day (D) 7. Mean ± SEM; 3 animals per group.
FIG. 3.
FIG. 3.
β-Cells are not generated in PDL-injured pancreas. Sham operation or PDL was performed in mixed genetic background mice after they were killed at 7, 14, or 30 days (AE and GI). Five-micrometer sections were obtained from pancreata every 95 μm followed by detection of β-cell and total pancreas area. Total pancreas was detected with amylase antisera and autofluorescence. Equivalent studies were also performed in Balb/c mice after they were killed at 7 days, with sections obtained every 160 μm (F and JL). A: Image sequences through the entire pancreas of sham-operated and PDL tail samples. Pancreas (green), insulin (white). B: Images from sham-operated and PDL tail at 7, 14, or 30 days. Pancreas (green), insulin (red). CF: Morphometric analysis of cross-sectional β-cell area at day 7 (C and F), 14 (D), or 30 (E). β-Cell area for each longitudinal pancreas section is plotted as points within a vertical column representing individual mice, expressed as % total pancreas area per section. GL: Quantitative analysis of cumulative total pancreas area, expressed as micrometers squared. G and J: PDL results in a drastic reduction in total cross-sectional pancreas area. H and K: Cumulative total β-cell area is unchanged by PDL, expressed as micrometers squared. I and L: β-Cell mass is unchanged by PDL, expressed as milligrams. Data are means ± SEM; 4–5 animals per group. Scale bars: 2 mm. **P < 0.01, ****P < 0.0001, ligated vs. unligated pancreas tail. D, day.
FIG. 4.
FIG. 4.
PDL induces serial proliferation of cells in duct cells but not in β-cells or their adult progenitors. A: Labeling scheme used to assess the replicative origin of β-cells after PDL. PDL or sham operation was performed in 6-week-old mixed genetic background mice, followed by sequential labeling with CldU and then IdU before they were killed. B: Sequential proliferation within ductal structures but not islets after PDL. Images from tail pancreas from sham-operated and PDL pancreas at 7, 14, or 30 days (D). Insulin (yellow), CldU (green), IdU (red), and pancytokeratin (white). Arrow heads indicate CldU+ IdU+ copositive cells. Scale bars: 100 μm. C: Quantitative analysis of β-cell proliferation after thymidine analog labeling, as measured by insulin+ cells that contained CldU+, IdU+, or both. Data are means ± SEM; 4–5 animals per group. D: Unaltered cumulative β-cell proliferation during the weeks after PDL, as measured by thymidine analog incorporation (CldU+ or IdU+) within insulin+ cells. *P < 0.05, **P < 0.01, ligated vs. unligated pancreas tail.
FIG. 5.
FIG. 5.
PDL does not stimulate β-cell proliferation. A: PDL stimulates proliferation of cells within the duct cells but not β-cells. Images from tail pancreas from sham-operated (control) and PDL pancreas at 7, 14, or 30 days. Insulin (yellow), glucagon (Gluc)/pancreatic polypeptide (pp)/somatostatin (somato) (green), ki67 (red), and DAPI (blue). B and C: Quantitative analysis of islet proliferation in sham and ligated pancreas tail. Data are means ± SEM; 5 animals per group. B: Unaltered β-cell proliferation (insulin+ ki67+) after PDL. C: Unaltered proliferation of other islet endocrine cells (glucagon/pancreatic polypeptide/somatostatin+ ki67+). DF: PDL increases intraislet proliferation without altering β-cell proliferation in the Balb/c cohort. D: Images from tail pancreas from sham-operated (control) and PDL pancreas at 7 days (D). DAPI (blue), insulin (yellow), BrdU (red). Triangles indicate BrdU+ cells that do not express insulin. E: Quantitative analysis of β-cell proliferation (insulin+ BrdU+). F: Quantitative analysis of total intraislet BrdU+ proliferation. Data are means ± SEM; 5 animals per group. Scale bars: 50 μm. **P < 0.01, ligated vs. unligated pancreas tail. G: Partial pancreatectomy stimulates β-cell proliferation in the Balb/c cohort. Quantitative analysis of proliferation in β-cells (insulin+ BrdU+) and extraislet cells. Data are means ± SEM; 5 animals per group.
FIG. 6.
FIG. 6.
PDL does not convert non-β-cells to the β-cell lineage. A: Genetic lineage tracing scheme used to assess the cellular origin of β-cells after PDL. B: Highly efficient induction of recombination within β-cells after tamoxifen treatment in control mice. C and D: Images of tail pancreas from tamoxifen-treated sham-operated control mice. DAPI (blue), insulin (red), YFP (green). Unchanged proportion of recombined β-cells after PDL at 7 days (C) and 30 days (D). E: Quantitative analysis of β-cell recombination. Data are means ± SEM; 4–5 animals per group. Scale bars: 50 μm. D, day.
FIG. 7.
FIG. 7.
PDL does not convert multipotent progenitors to the β-cell lineage. A: Lineage-tracing scheme used to assess the cellular origin of β-cells after PDL. B and C: Tamoxifen-dependent recombination. Images of tail pancreas from mice treated with a single dose of tamoxifen (0.015 g/kg) followed by sham operation or PDL (mice killed at 7 days). B: DAPI (blue), YFP (green), insulin (red), pancytokeratin (white). C: DAPI (blue), YFP (green), insulin (red), amylase (white). DF: Quantitative analysis of multicellular clones, assessed by the presence of ductal clusters of YFP+ pancytokeratin+ cells (D), β-cell clusters of YFP+ insulin+ cells (E), and pancreatic acinar cell clusters of YFP+ amylase+ cells (F). Scale bars: 50 μm. *P < 0.05, ligated vs. unligated pancreas tail. D, day.

References

    1. Granger A, Kushner JA. Cellular origins of beta-cell regeneration: a legacy view of historical controversies. J Intern Med 2009;266:325–338 - PMC - PubMed
    1. Kushner JA, Weir GC, Bonner-Weir S. Ductal origin hypothesis of pancreatic regeneration under attack. Cell Metab 2010;11:2–3 - PMC - PubMed
    1. Collombat P, Xu X, Heimberg H, Mansouri A. Pancreatic beta-cells: from generation to regeneration. Semin Cell Dev Biol 2010;21:838–844 - PMC - PubMed
    1. Bonner-Weir S, Li WC, Ouziel-Yahalom L, Guo L, Weir GC, Sharma A. Beta-cell growth and regeneration: replication is only part of the story. Diabetes 2010;59:2340–2348 - PMC - PubMed
    1. Desgraz R, Bonal C, Herrera PL. β-cell regeneration: the pancreatic intrinsic faculty. Trends Endocrinol Metab 2011;22:34–43 - PubMed

Publication types

MeSH terms