. 2013 Jun;62(6):1932-44.
doi: 10.2337/db12-0222. Epub 2013 Jan 24.

Galectin-3 deficiency accelerates high-fat diet-induced obesity and amplifies inflammation in adipose tissue and pancreatic islets

Affiliations

Galectin-3 deficiency accelerates high-fat diet-induced obesity and amplifies inflammation in adipose tissue and pancreatic islets

Nada N Pejnovic et al. Diabetes. 2013 Jun.

Abstract

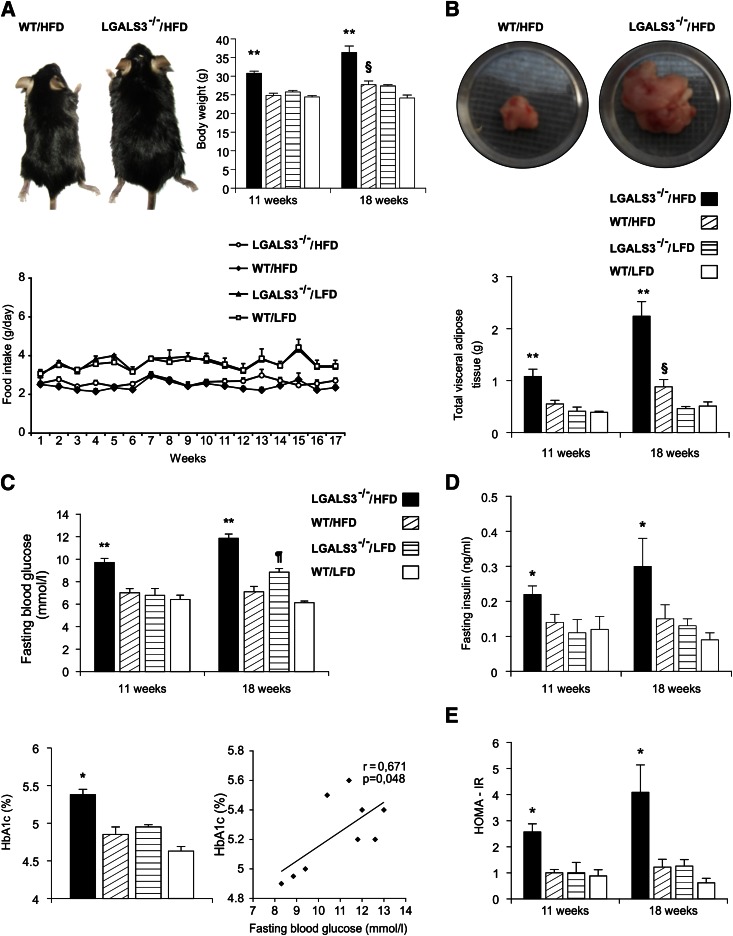
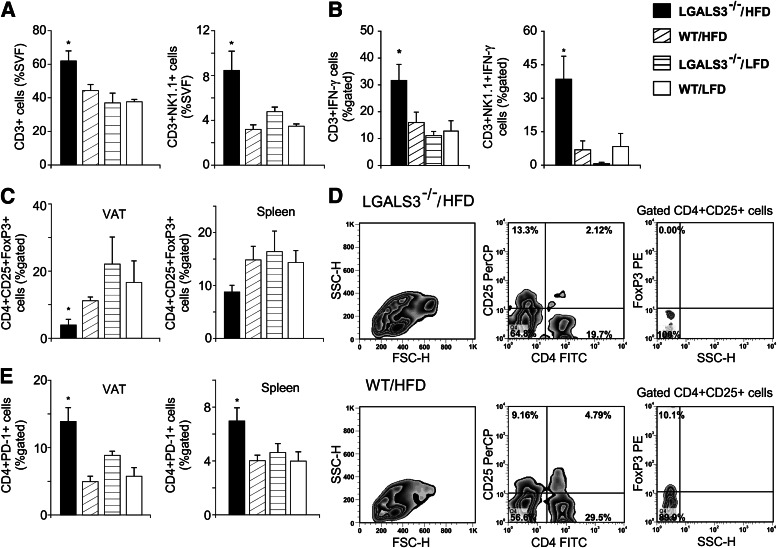
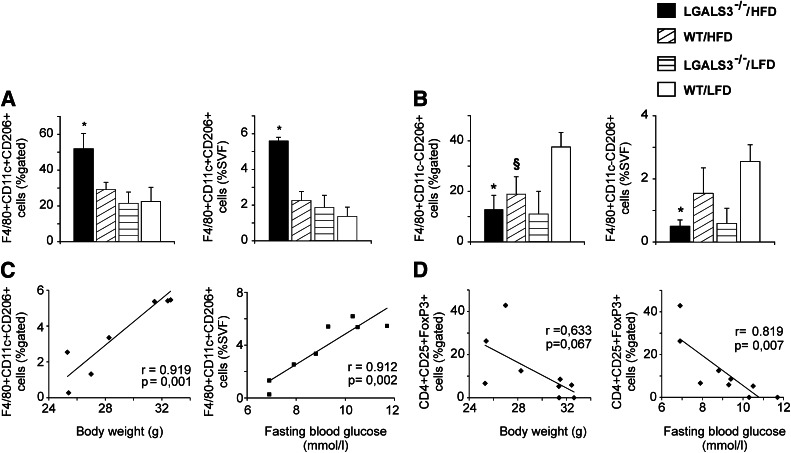
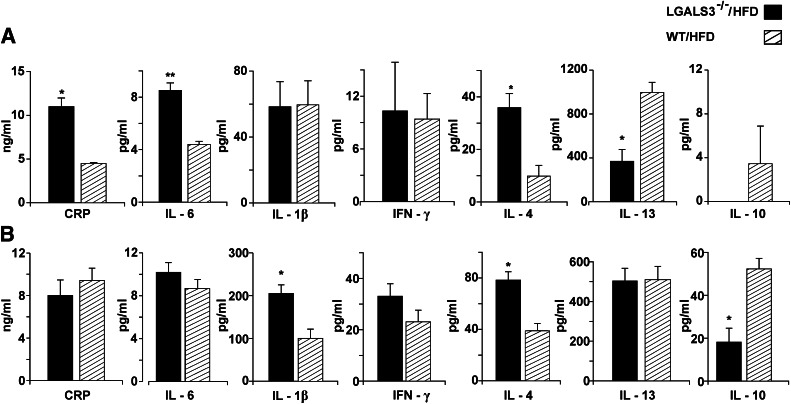
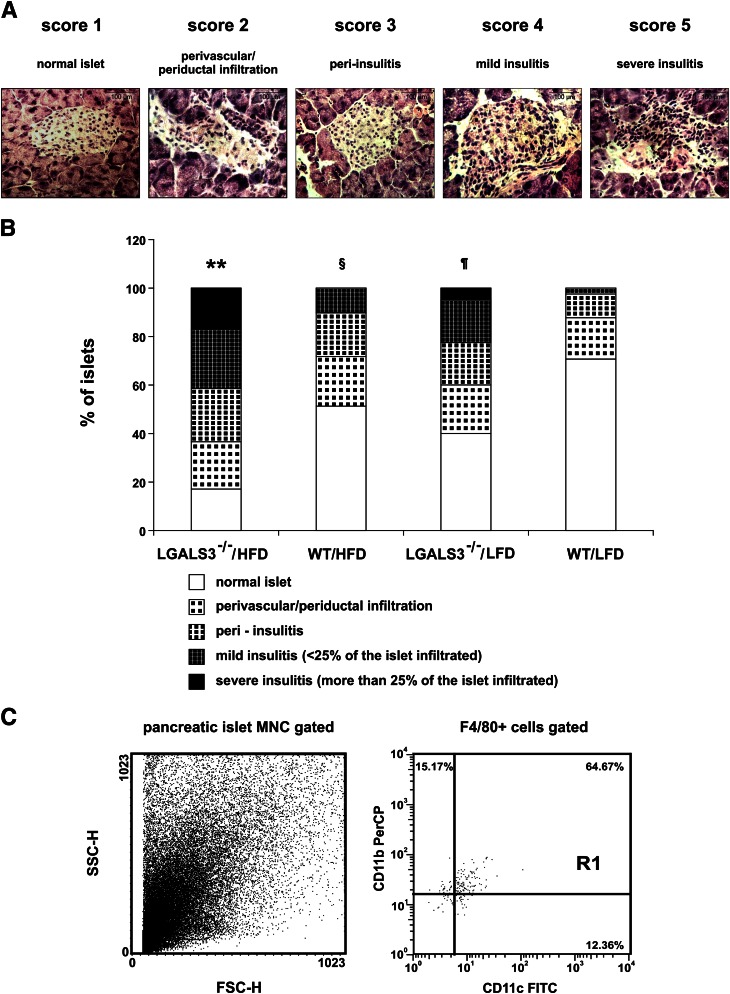
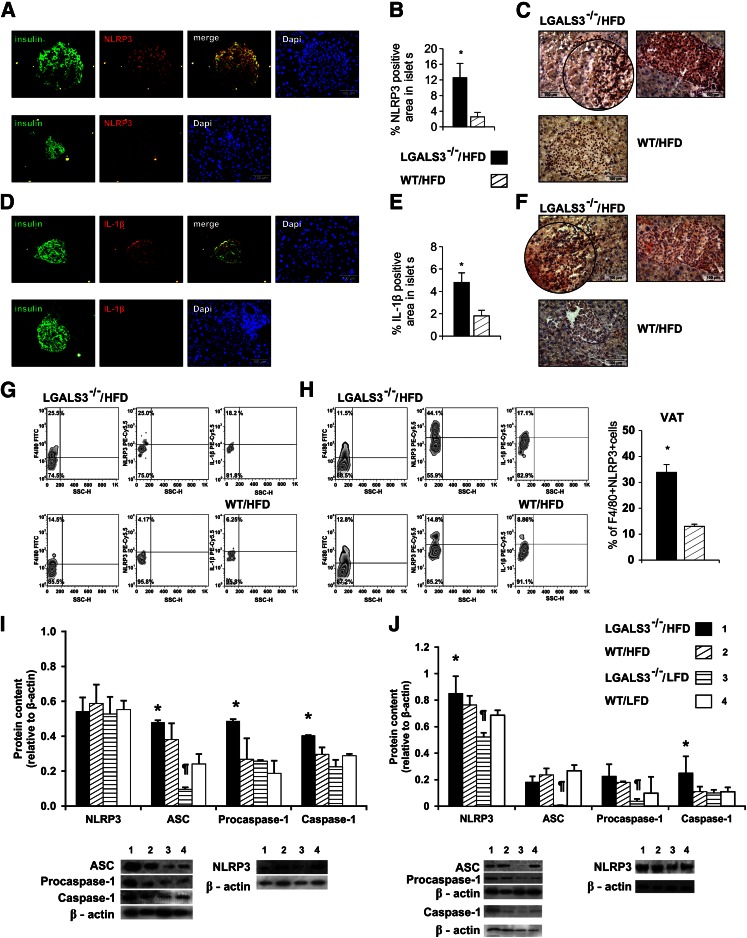
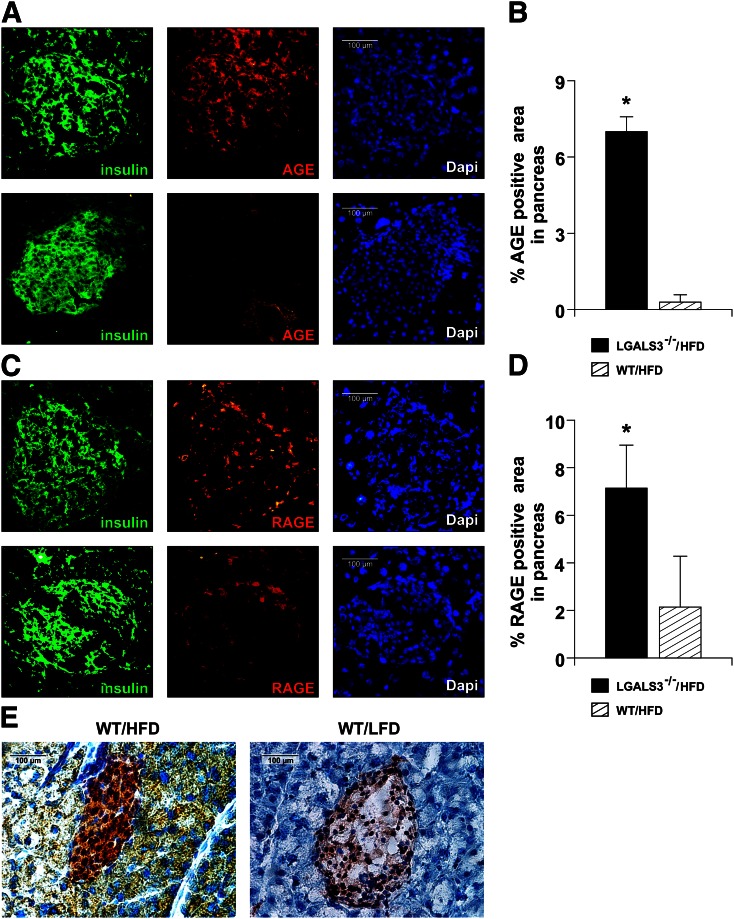
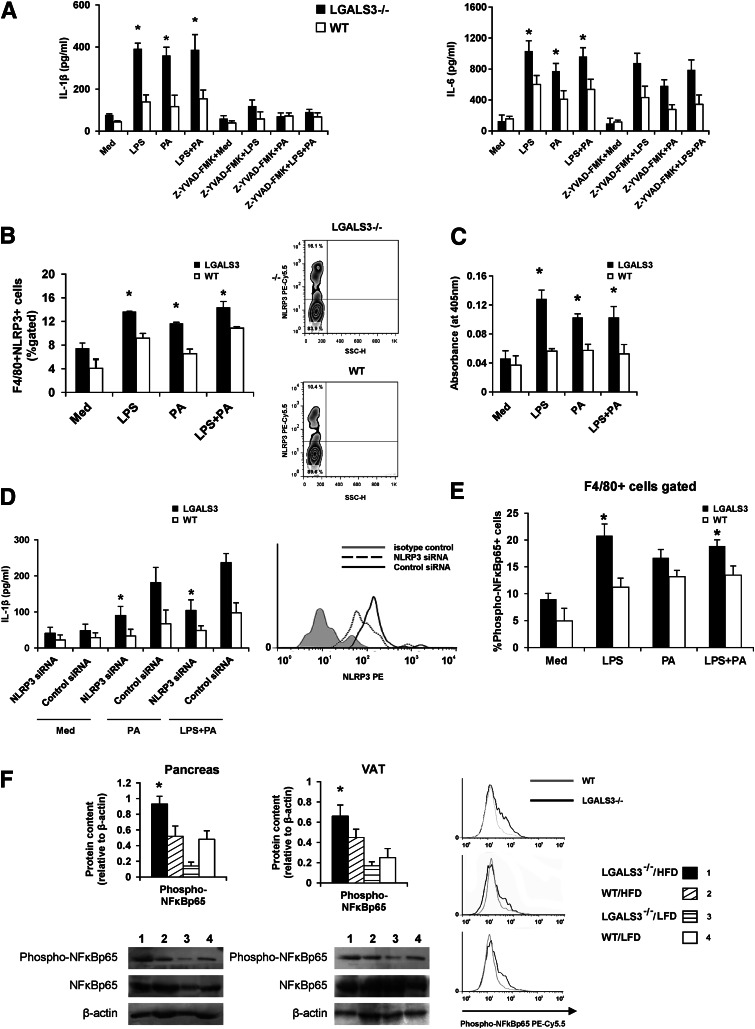
Obesity-induced diabetes is associated with low-grade inflammation in adipose tissue and macrophage infiltration of islets. We show that ablation of galectin-3 (Gal-3), a galactoside-binding lectin, accelerates high-fat diet-induced obesity and diabetes. Obese LGALS3(-/-) mice have increased body weight, amount of total visceral adipose tissue (VAT), fasting blood glucose and insulin levels, homeostasis model assessment of insulin resistance, and markers of systemic inflammation compared with diet-matched wild-type (WT) animals. VAT of obese LGALS3(-/-) mice exhibited increased incidence of type 1 T and NKT lymphocytes and proinflammatory CD11c(+)CD11b(+) macrophages and decreased CD4(+)CD25(+)FoxP3(+) regulatory T cells and M2 macrophages. Pronounced mononuclear cell infiltrate, increased expression of NLRP3 inflammasome and interleukin-1β (IL-1β) in macrophages, and increased accumulation of advanced glycation end products (AGEs) and receptor for AGE (RAGE) expression were present in pancreatic islets of obese LGALS3(-/-) animals accompanied with elevated phosphorylated nuclear factor-κB (NF-κB) p65 and mature caspase-1 protein expression in pancreatic tissue and VAT. In vitro stimulation of LGALS3(-/-) peritoneal macrophages with lipopolysaccharide (LPS) and saturated fatty acid palmitate caused increased caspase-1-dependent IL-1β production and increased phosphorylation of NF-κB p65 compared with WT cells. Transfection of LGALS3(-/-) macrophages with NLRP3 small interfering RNA attenuated IL-1β production in response to palmitate and LPS plus palmitate. Obtained results suggest important protective roles for Gal-3 in obesity-induced inflammation and diabetes.


Figures

FIG. 1.
FIG. 1.
LGALS3−/− mice fed HFD have increased body weight, enhanced visceral adiposity, hyperglycemia, hyperinsulinemia, and increased HOMA-IR. A: An image of the larger body size of LGALS3−/− vs. WT mice fed HFD. A significant increase in body weights of HFD-fed LGALS3−/− mice compared with other experimental groups after 11 or 18 weeks, and WT mice fed HFD vs. WT mice fed LFD after 18 weeks. Food intake in LGALS3−/− and WT mice. B: Significantly increased amount of VAT in HFD-fed LGALS3−/− mice vs. other experimental groups after 11 or 18 weeks and WT mice on different diets after 18 weeks. C: Significant hyperglycemia of LGALS3−/− mice on HFD compared with other experimental groups after 11 or 18 weeks and LFD-fed LGALS3−/− vs. WT mice after 18 weeks. Increased HbA1c (%) of LGALS3−/− mice on HFD vs. other experimental groups, which significantly correlates with fasting blood glucose levels in LGALS3−/− mice (r = 0.671, P = 0.048). D: Significant increase of fasting insulin levels in sera of LGALS3−/− fed HFD vs. other experimental groups after 11 or 18 weeks. E: Significant increase of HOMA-IR in HFD-fed LGALS3−/− mice compared with other experimental groups after 11 or 18 weeks. The results are shown as the means ± SEM for 8–12 animals (11 weeks) or four to seven mice (18 weeks) per group. r, Pearson correlation coefficient. *P < 0.05; **P < 0.001; ¶P < 0.05; §P < 0.05. (A high-quality color representation of this figure is available in the online issue.)
FIG. 2.
FIG. 2.
Increased type 1 T and NKT cells and reduced Tregs in VAT of HFD-fed LGALS3−/− mice. A: Increased percentages of CD3+ T cells and in VAT of LGALS3−/− mice fed HFD compared with other groups after 11 weeks. CD3+NK1.1+ NKT cells in VAT of LGALS3−/− mice fed HFD were significantly increased compared with WT mice on both diet conditions. B: LGALS3−/− mice fed HFD have significantly increased frequencies of CD3+IFN-γ+ in VAT compared with LFD-fed mice of both genotypes, whereas CD3+NK1.1+ NKT cells that express IFN-γ were significantly higher compared with other experimental groups. C: Adipose tissue regulatory CD4+CD25+FoxP3+ T cells are reduced, and the trend toward decreased Tregs is observed in spleens (P = 0.071) of LGALS3−/− vs. WT mice fed HFD. D: Representative fluorescence-activated cell sorter plot of CD4+CD25+FoxP3+ T cells in VAT from HFD-fed LGALS3−/− and WT mice. E: Significantly increased percentages of CD4+PD-1+ cells in VAT and spleen from HFD-fed LGALS3−/− mice vs. WT mice on both diet conditions. The results are shown as the means ± SEM for four to six animals per group. FSC-H, forward-scattered light; FITC, fluorescein isothiocyanate; SSC-H, side-scattered light in flow cytometry; SVF, stromal vascular fraction. *P < 0.05.
FIG. 3.
FIG. 3.
Increased frequencies of adipose tissue F4/80+CD11c+CD206+ macrophages in obese LGALS3−/− mice correlate with body weights and blood glucose levels in LGALS3−/− mice. A: LGALS3−/− mice fed HFD for 11 weeks have significantly increased percentages of F4/80+CD11c+CD206+ macrophages in VAT compared with other experimental groups. B: LGALS3−/− fed HFD have significantly lower percentages of alternatively activated F4/80+CD11c-CD206+ M2 macrophages in VAT compared with WT mice fed LFD. C: Positive correlation between the frequencies of proinflammatory F4/80+CD11c+CD206+ macrophages with body weights (r = 0.919, P = 0.001) and fasting blood glucose levels (r = 0.912, P = 0.002) in LGALS3−/− mice. D: Inverse correlation between the frequencies of Tregs with body weights (r = 0.633, P = 0.067) and blood glucose levels (r = 0.819, P = 0.007) in LGALS3−/− mice. r, Pearson correlation coefficient. The results are shown as the means ± SEM for four to six animals per group. SVF, stromal vascular fraction. *P < 0.05; §P < 0.05.
FIG. 4.
FIG. 4.
Serum cytokine levels in HFD-fed LGALS3−/− and WT mice. A: CRP and cytokine levels in LGALS3−/− and WT mice fed HFD for 11 weeks. B: CRP and cytokine levels in LGALS3−/− and WT mice fed HFD for 18 weeks. The results are shown as the means ± SEM for four to six animals (11 weeks) or four to seven mice (18 weeks) per group. *P < 0.05.
FIG. 5.
FIG. 5.
Histological analysis of infiltrating mononuclear cells in pancreatic islets. A: Hematoxylin-eosin staining was performed on pancreatic tissue sections. Representative images of insulitis scores in LGALS3−/− mice fed HFD for 11 weeks. Original magnification ×40. Scale bars, 100 µm. B: Pancreatic islet inflammation (insulitis) was graded from 1 to 5, according to the extent of peri- and intraislet infiltration by mononuclear leukocytes as follows: 1, no islet infiltration; 2, peri-vascular/periductal islet infiltration; 3, peri-insulitis; 4, mild insulitis (<25% islet area infiltrated); 5, severe insulitis (>25% islet area infiltrated). LGALS3−/− mice on HFD had a significantly increased percentage of islets with severe insulitis compared with other experimental groups. LGALS3−/− mice on LFD had a significantly higher percentage of severe insulitis compared with WT mice on both diet conditions. The results are shown as percentages of islets with insulitis derived from four to six mice per group. **P < 0.001; ¶P < 0.05; §P < 0.05. C: FACS plots of mononuclear cells isolated from the pooled pancreata (n = 5) of LGALS3−/− mice fed HFD. The dot plots depict forward-scattered light (FSC) and side-scattered light in flow cytometry (SSC) (left) and the CD11b+CD11c+ cells among gated F4/80+ cells (right). In FACS analyses, mononuclear infiltrates were not found in mice from other experimental groups. (A high-quality color representation of this figure is available in the online issue.)
FIG. 6.
FIG. 6.
Increased expression of NLRP3 inflammasome and IL-1β in pancreatic islets of LGALS3−/− mice fed HFD. A: Immunofluorescence staining for insulin (green) and NLRP3 inflammasome (red) together with DNA staining with DAPI (blue) in pancreatic islets from representative HFD-fed LGALS3−/− (top) or WT mice (bottom). B: Imunohistochemical analyses of the amount of NLRP3 inflammasome–positive areas in islets were performed on pancreatic tissue sections (four to six mice per group). *P < 0.05. C: Representative IHC staining of F4/80+ macrophages (brown) and NLRP3 inflammasome (red) in islets from HFD-fed LGALS3−/− or WT mice. D: Immunofluorescence staining for insulin (green) and IL-1β (red) together with DNA staining with DAPI (blue) in pancreatic islets from representative HFD-fed LGALS3−/− (top) or WT mice (bottom). E: Imunohistochemical analyses of the amount of IL-1β–positive areas in islets were performed on pancreatic tissue sections (four to six mice per group). *P < 0.05. F: Representative IHC staining of F4/80+ macrophages (brown) and IL-1β (red) in islets from HFD-fed LGALS3−/− or WT mice. G: Representative FACS plot of F4/80+NLRP3+ and F4/80+IL-1β+ macrophages in the pancreas of HFD-fed LGALS3−/− and WT mice. H: Representative FACS plot of F4/80+NLRP3+ and F4/80+IL-1β+ macrophages in VAT of HFD-fed LGALS3−/− and WT mice. Significantly increased percentage of F4/80+NLRP3+ macrophages in HFD-fed LGALS3−/− vs. WT mice. *P < 0.05. I: Western blot analyses of NLRP3, ASC, procaspase-1, and caspase-1 expression in the pancreas. HFD-fed LGALS3−/− mice had significantly higher ASC expression when compared with LFD-fed LGALS3−/− and WT mice, significantly higher procaspase-1 expression when compared with all experimental groups, and significantly higher active caspase-1 expression when compared with LGALS3−/− mice fed LFD (all *P < 0.05). ASC expression was significantly higher in HFD-fed WT mice compared with LFD-fed LGALS3−/− mice. ¶P < 0.05. J: Western blot analyses of NLRP3, ASC, procaspase-1, and caspase-1 expression in VAT. LGALS3−/− mice on HFD showed significantly increased expression of NLRP3 when compared with LFD-fed LGALS3−/− and WT mice and significantly increased expression of active caspase-1 when compared with all experimental groups (all *P < 0.05). NLRP3 and ASC expression were significantly lower in LFD-fed LGALS3−/− mice compared with HFD or LFD-fed WT mice (all ¶P < 0.05). Procaspase-1 was significantly lower in LFD-fed LGALS3−/− mice compared with HFD-fed WT mice. ¶P < 0.05. The results are representative of two to three repeated experiments.
FIG. 7.
FIG. 7.
Increased expression of AGE and RAGE in pancreatic islets of HFD-fed LGALS3−/− mice. A: Immunofluorescence staining for insulin (green) and AGE (red) together with DNA staining with DAPI (blue) in pancreatic islets from representative LGALS3−/− (top) and WT mice fed an HFD (bottom). B: Evaluation of % AGE-positive areas was performed on IHC-stained tissue sections from four to six mice per group. C: Immunofluorescence staining for insulin (green) and RAGE (red) together with DNA staining with DAPI (blue) in pancreatic islets from representative LGALS3−/− (top) and WT mice fed an HFD (bottom). D: Evaluation of % RAGE-positive areas was performed on IHC-stained tissue sections from four to six mice per group. E: Representative IHC image of Gal-3 expression in HFD- or LFD-fed WT mice. The results are representative of two to three repeated experiments. *P < 0.05.
FIG. 8.
FIG. 8.
Stimulated LGALS3−/− peritoneal macrophages have increased NLRP3 inflammasome expression, caspase-1–dependent IL-1β production, and higher expression of phosphorylated NF-κB p65. A: Significantly higher production of IL-1β by LGALS3−/− vs. WT peritoneal macrophages upon simulation with LPS (100 ng), palmitate-BSA (PA-BSA) (100 µmol/L), or LPS plus PA, whereas the production was significantly reduced in the presence of the caspase-1 inhibitor Z-YVAD (10 µmol/L). LGALS3−/− macrophages stimulated with LPS, PA, or LPS plus PA produce more IL-6 when compared with WT macrophages, and the production was not affected by caspase-1 inhibitor Z-YVAD. B: Significantly increased percentage of F4/80+NLRP3+ macrophages in LGALS3−/− vs. WT mice when stimulated with LPS, PA-BSA, or LPS plus PA. Representative FACS plot of F4/80+NLRP3+ peritoneal macrophages in LGALS3−/− and WT mice. C: Significantly increased caspase-1 activity in cell lysates of LGALS3−/− peritoneal macrophages stimulated with LPS (100 ng), PA (100 µmol/L), or LPS plus PA in comparison with WT peritoneal macrophages. D: Significantly reduced palmitate (100 µmol/L) and LPS (100 ng) plus palmitate (100 µmol/L) stimulated IL-1β production from LGALS3−/− macrophages transfected with NLRP3 siRNA compared with cells treated with control siRNA. Representative histogram of NLRP3 expression in macrophages transfected with NLRP3 siRNA or control siRNA. E: Significantly increased expression of phosphorylated NF-κB p65 in LGALS3−/− macrophages stimulated with LPS (1 μg/mL) and LPS plus PA (100 µmol/L) when compared with WT macrophages. Representative histograms of F4/80+ macrophages expressing NF-κB p65 (phospho-S536) in LGALS3−/− and WT mice. F: Western blot analyses of NF-κB p65 and phospho–NF-κB p65 expression in the pancreas and VAT. HFD-fed LGALS3−/− mice have significantly increased expression of phosphorylated NF-κB p65 when compared with all experimental groups in the pancreas and compared with LFD-fed LGALS−/− and WT mice in VAT. All experimental groups have a similar expression of total NF-κB p65 in the pancreas and VAT. The results are representative of two to three repeated experiments. *P < 0.05.

References

    1. Lumeng CN, Saltiel AR. Inflammatory links between obesity and metabolic disease. J Clin Invest 2011;121:2111–2117 - PMC - PubMed
    1. Feuerer M, Herrero L, Cipolletta D, et al. Lean, but not obese, fat is enriched for a unique population of regulatory T cells that affect metabolic parameters. Nat Med 2009;15:930–939 - PMC - PubMed
    1. Nishimura S, Manabe I, Nagasaki M, et al. CD8+ effector T cells contribute to macrophage recruitment and adipose tissue inflammation in obesity. Nat Med 2009;15:914–920 - PubMed
    1. Weisberg SP, McCann D, Desai M, Rosenbaum M, Leibel RL, Ferrante AW., Jr Obesity is associated with macrophage accumulation in adipose tissue. J Clin Invest 2003;112:1796–1808 - PMC - PubMed
    1. Xu H, Barnes GT, Yang Q, et al. Chronic inflammation in fat plays a crucial role in the development of obesity-related insulin resistance. J Clin Invest 2003;112:1821–1830 - PMC - PubMed

Publication types

MeSH terms