. 2013;11(1):e1001469.
doi: 10.1371/journal.pbio.1001469. Epub 2013 Jan 22.

Radial glial neural progenitors regulate nascent brain vascular network stabilization via inhibition of Wnt signaling

Affiliations

Radial glial neural progenitors regulate nascent brain vascular network stabilization via inhibition of Wnt signaling

Shang Ma et al. PLoS Biol. 2013.

Abstract

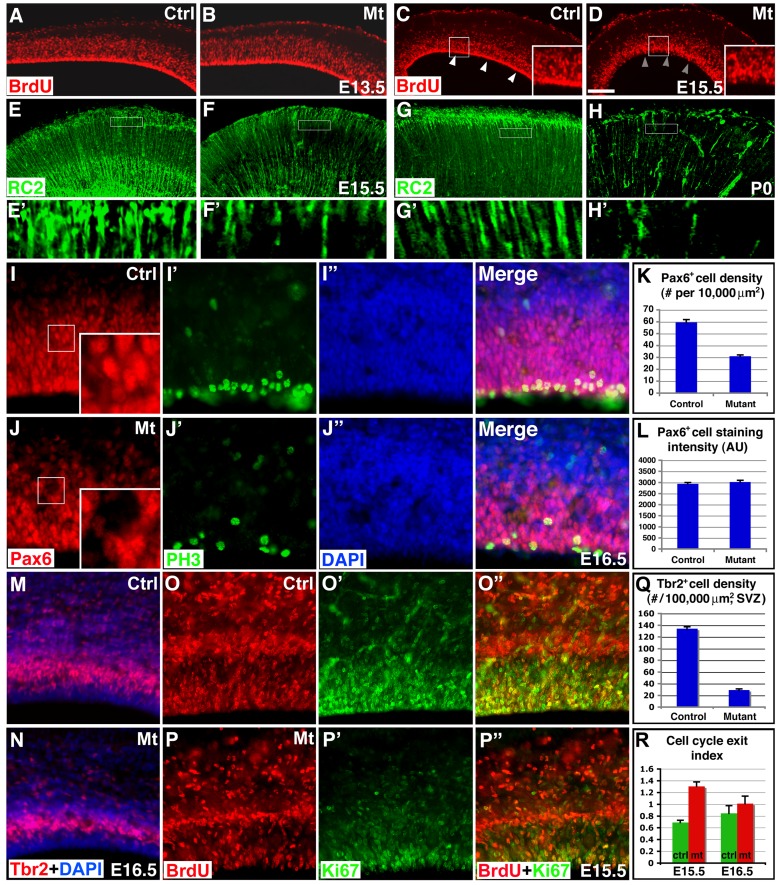
The cerebral cortex performs complex cognitive functions at the expense of tremendous energy consumption. Blood vessels in the brain are known to form stereotypic patterns that facilitate efficient oxygen and nutrient delivery. Yet little is known about how vessel development in the brain is normally regulated. Radial glial neural progenitors are well known for their central role in orchestrating brain neurogenesis. Here we show that, in the late embryonic cortex, radial glial neural progenitors also play a key role in brain angiogenesis, by interacting with nascent blood vessels and regulating vessel stabilization via modulation of canonical Wnt signaling. We find that ablation of radial glia results in vessel regression, concomitant with ectopic activation of Wnt signaling in endothelial cells. Direct activation of Wnt signaling also results in similar vessel regression, while attenuation of Wnt signaling substantially suppresses regression. Radial glial ablation and ectopic Wnt pathway activation leads to elevated endothelial expression of matrix metalloproteinases, while inhibition of metalloproteinase activity significantly suppresses vessel regression. These results thus reveal a previously unrecognized role of radial glial progenitors in stabilizing nascent brain vascular network and provide novel insights into the molecular cascades through which target neural tissues regulate vessel stabilization and patterning during development and throughout life.


Conflict of interest statement

The authors have declared that no competing interests exist.

Figures

Figure 1
Figure 1. Vascular development in the mouse embryonic cortex.
(A–D) Patterns of vessel growth from E14.5 to E17.5. IB4 (in green) was used to stain growing vessels in the cortical plate (CP, outlined by pairs of white bars in A–D). A small number of vessels are observed at E14.5 (A), while increased numbers are observed at E15.5 (B) and E16.5 (C). By E17.5, the most prominent vessels run in the vertical orientation (D). (E–F) Quantification of vessel density (E) and branching frequency (F) in the cortical plate. Vessel branching frequency increases from E13.5 and peaks at E15.5 and E16.5. Subsequently, it drops dramatically at E17.5. By contrast, vessel density remains relatively stable after E15.5. (G–H″) Patterns of cortical plate blood vessels as visualized using an mTomato/mEGFP reporter, which, when driven by the neural-specific nestin-cre, expresses mEGFP (in green) in radial glia but mTomato (in red) in vessels at both E16.5 (G–G″) and E17.5 (H–H″). In contrast to E16.5, the vast majorities of vessels run vertically at E17.5. (I–J) Direct interactions between radial glia and ECs at E16.5 by 3-D reconstruction. ECs, pericytes, and radial glia were labeled with IB4 (in green) and NG2 (in blue) and GLAST (in red) antibodies, respectively. Cross-sections showed direct interactions between ECs and radial glia (arrows) despite significant pericyte coverage. (K–L) Direct interactions between radial glia and ECs were also observed at E16.5 by BLBP labeling of radial glia (in red). ECs were labeled by IB4 (in green). Cross-sections showed direct interactions between ECs and radial glia (arrows). Scale bar (in H″): 100 µm for (A–D) and (G–H″).
Figure 2
Figure 2. Blockade of cell cycle progression reduces cortical neural progenitors without affecting cell fate.
(A–D) Effects of orc3 deletion on radial glial division. BrdU labeling (in red) revealed no obvious defects in ventricular zone division at E13.5, but substantial reductions at E15.5, especially at the ventricular surface (arrowheads in C and D). (E–H) Effects of orc3 deletion on radial glial density. RC2 staining (in green) revealed substantial reductions in radial glial density at E15.5 and near complete loss at P0. Boxed areas in (E–H) are shown in (E′–H′). Also notice more severe loss of radial glia in the mutant medial cortex (right side in H). (I–J″) Effects of orc3 deletion on radial glial fate. Although reduced in number, mutant radial glia express normal levels of Pax6 (in red) (I and J) at E16.5. PH3 (in green) staining also revealed a reduced number of mitotic cells at the ventricular surface (I′ and J′). (K–L) Quantification of Pax6+ cell density and expression level. Significant differences were observed in Pax6+ cell density (p = 0.0003, n = 4) but not Pax6 staining intensity (p = 0.32, n = 20). Note cells are less densely packed in mutants. (M–N) Effects of orc3 deletion on intermediate progenitors. Tbr2 staining (red) revealed severe reduction in intermediate progenitors in mutants at E16.5. (O–P″) Cell cycle exit analysis at E15.5. BrdU was administered at E14.5 followed by staining for BrdU (red in O, P, O″, and P″) and Ki67 (green in O′, P′, O″, and P″) at E15.5. (Q) Quantification of Tbr2+ cells in the subventricular zone at E16.5. Significant reductions were observed in mutants at E16.5 (p = 3×10⁻¹⁵, n = 9). (R) Cell cycle exit indices at E15.5 and E16.5. Significant increases were observed in mutants at E15.5 (p = 0.0001, n = 5), but not at E16.5 (p = 0.39, n = 5). Scale bar (in D): 200 µm for (A–D), 50 for µm for (E–H), and 60 µm for (I–J″) and (M–P″).
Figure 3
Figure 3. Ablation of neural progenitors results in defective cortical angiogenesis.
(A–B) Neonatal brain hemorrhage in orc3 mutants. Immunoglobulin reactivity further confirmed patterns of hemorrhage (B). (C–F) Vessel morphology at P0 along the anterior-posterior axis. IB4 (in green) and laminin (LN, in red) staining revealed severe loss of vessels in mutants in both the anterior (C and D) and posterior (E and F) cortex. (G–H) Quantitative analysis of cortical plate vessel density and branching frequency. Dramatic reductions in both vessel density (G) and branch point frequency (H) were observed (p = 1.76×10⁻¹⁴ and p = 1.01×10⁻⁸, respectively; n = 9). (I–J) Correlation between radial glial density and vessel density (I) as well as between radial glial density and vessel branching frequency (J) in the medial cortex of control, orc3/nestin-cre, and orc3/hGFAP-cre mutant neonates. The correlation coefficient was 0.97 for the former (I) and 0.98 for the latter (J). Scale bar (in F): 500 µm for (B–F).
Figure 4
Figure 4. Ablation of neural progenitors results in cortical vessel regression independent of defects in pericyte recruitment.
(A–H) Vessel morphology from E15.5 to E18.5. IB4 staining (in green) revealed no obvious defects at E15.5 (A and B) but significant defects at E16.5 (C and D), E17.5 (E and F), and E18.5 (G and H). (I–J) Quantification of vessel density and branching frequency from E15.5–17.5. Significant decreases (*) in both parameters were observed at E16.5 (p = 0.03 and 0.0003, n = 3) and E17.5 (p = 0.7×10⁻⁵ and 0.007, n = 5), but not at E15.5 (p = 0.52 and 0.25, n = 4). (K–N) Pericyte investment of vessels. Desmin staining (in red) surrounds CD31+ (in green) vessels similarly in mutants (L), as in controls (K). Boxed areas in (K and L) are shown in two right panels. PDGFRβ+ (in green) cells (some highlighted by arrowheads) were also associated with IB4+ (in red) vessels similarly in mutants (N), as in controls (M). PDGFRβ staining in boxed areas are shown as insets. (O) Quantification of PDGFRβ+ pericyte density. Pericytes along all vessels were quantified. No significant differences were observed (p = 0.62, n = 4). (P–Q′) Collagen IV staining. Collagen IV+ (in red) empty sleeves (arrowheads in Q′) were frequently observed in mutants (Q–Q′), in contrast to controls (P–P′). (R–S) Vessel perfusion. Neonates were perfused trans-cardially using 1% FITC-dextran (in green) followed by IB4 (in red) staining. Many vessels in mutant brains (S) were not well perfused (arrowhead in S), in contrast to those in controls (R). Scale bar (in D): 200 µm for (A–H), (K–N), and (R–S), 80 µm for (P–Q′).
Figure 5
Figure 5. Increased proliferation and up-regulated canonical Wnt pathway activity in ECs following neural progenitor ablation.
(A–B′) Cortical EC proliferation at E16.5. BrdU labeling (in red) revealed increased clusters (arrowheads) of BrdU+ ECs (IB4 in green) in mutants (B and B′). (C–D′) Ki67 staining at E16.5. Increased clusters of Ki67+ ECs (in red, arrowheads) were observed in mutants (D and D′). (E–F) Glut-1 expression in ECs at E16.5. Up-regulation of Glut-1 expression (in red) was observed in mutants (F). (G–H) Expression of Wnt reporter BAT-lacZ in ECs at E16.5. X-Gal reaction revealed increased numbers of lacZ+ (in blue, arrowheads) ECs (IB4 in brown) in mutants (H). BAT-lacZ up-regulation in neural cells appears largely restricted to the intermediate zone (IZ). (I–J) Western blot analysis of Glut-1 expression at E16.5. Stronger bands were observed in mutants (I). Quantification showed a >150% increase in mutants (J) (p = 0.03, n = 3). (K–L) Quantification of EC proliferation and BAT-lacZ expression at E16.5. The density of both BrdU+ (p = 0.001; n = 4) and lacZ+ (p = 0.001; n = 3) ECs is significantly increased in mutants. Scale bar (in D): 200 µm for (A–H).
Figure 6
Figure 6. Contact-dependent suppression of EC Wnt signaling by radial glia at E15.5 but not at E13.5.
(Aa–Be) Effects of contact with radial glia on EC Wnt pathway activity at E15.5. Cell cultures were stained for BAT-lacZ by X-gal reaction (in dark blue, in Ac, Ae, Bc, Be), followed by staining for EC marker CD31 (in green in Aa, Ad, Ba, Bd) and radial glial marker BLBP (in red in Ab, Ad, Bb, Bd). (Aa–Ae) Example of ECs (arrows) contacting radial glia (arrowhead) and showing minimal lacZ expression. (Ba–Be) Example of ECs (arrows) not contacting radial glia and showing strong lacZ expression. (C–D) Quantification of effects of radial glial interaction on EC BAT-lacZ expression at E15.5. The vast majorities of ECs interacting with radial glia (total 110 cells) do not express BAT-lacZ, while those that do not contact radial glia (total 133 cells) are overwhelmingly X-Gal+ (p = 1.4×10⁻⁹, n = 5) (C). Analysis of subgroups by ANOVA followed by Tukey's post hoc test also shows similarly significant effects of interaction with radial glia, but no significant effects of interactions with nonradial glia [p>0.05, between groups I (46 cells) and II (64 cells), as well as between groups III (61 cells) and IV (72 cells)] (D). (E) Quantification of effects of radial glial interaction on EC BAT-lacZ expression at E13.5. No significant differences were observed between the proportions of ECs contacting (total 76 cells) and not contacting radial glia (total 85 cells) that express BAT-lacZ (p = 0.16, n = 3). Scale bar (in Ba): 80 µm for (Aa–Be).
Figure 7
Figure 7. Activation of canonical Wnt signaling induces, while attenuation substantially suppresses, vessel regression.
(A–D) Effects of LiCl-mediated Wnt pathway activation on vessel development. LiCl treatment at E16.5–17.5 induces hemorrhage throughout E18.5 brains (A). Ter119 staining confirmed microhemorrhage throughout LiCl-treated brains (insets in A). Quantification showed significant decreases in vessel density in the cortex (p = 0.0057, n = 7), but not in the striatum (p = 0.88, n = 6) or the heart (p = 0.45, n = 3) following LiCl treatment (B). Vessel morphology in NaCl- and LiCl-treated E18.5 cortices is shown in (C and D). (E–F) Effects of SB216763-mediated Wnt pathway activation on vessel development. SB216763 treatment at E15.5–17.5 induces vessel loss in E18.5 brains (E). Quantification showed significant decreases in vessel density in the cortex (p = 3.4×10⁻⁵, n = 4) (F). (G–H) Effects of wnt7b mutation on Glut-1 expression in orc3 mutants. Introduction of wnt7b into orc3 mutant background suppresses increases in Glut-1 expression at E16.5 (G). Quantification of Glut-1 expression and analysis by ANOVA followed by Tukey's post hoc test shows that wnt7b mutation alone has no significant effects but suppresses Glut-1 expression in orc3 mutants (** p<0.01, n = 13) (H). (I–L) Effects of wnt7b mutation on vessel regression in orc3 mutants at P0. Introduction of wnt7b into orc3 mutant background suppresses brain hemorrhage (I). Quantification of vessel density and analysis by ANOVA followed by Tukey's post hoc test shows that wnt7b mutation alone has no significant effects on vessel density but suppresses vessel regression in orc3 mutants (**p<0.01, n = 4) (J). Cortical vessel morphology in orc3 single and orc3/wnt7b double mutants is shown in (K and L). Scale bar (in J): 200 µm for (C–E), 100 µm for (G), and 500 µm for (K–L).
Figure 8
Figure 8. Ectopic Wnt signaling may destabilize cortical vessels in part through up-regulation of MMP-2.
(A–B) Effects of radial glial ablation on vessel basement membrane. Staining with highly diluted anti-laminin (LN) antibodies (in red) revealed even labeling along control vessels (A), but frequent bright puncta in mutants (B). (C–D) MMP-2 expression along vessels at E16.5. Antibody staining (in brown) revealed low levels of MMP-2 along control vessels (C), which appear elevated in mutants (D). (E–F) Gelatin zymography. Full-length pro-MMP-2 activity appears substantially up-regulated in mutants at E16.5. Cleaved MMP-2 was also detected in mutants but not in controls. Quantification confirmed an over 170% increase in pro-MMP-2 levels (p = 0.006; n = 3) (F). (G–H) MMP-2 expression in brains treated with LiCl at E17.5. LiCl dramatically elevated MMP-2 expression along cortical vessels. (I–L) Effects of Timp2 mutation on vessel regression in orc3 mutants. Introduction of Timp2 mutation into orc3 mutant background substantially suppressed brain hemorrhage (I) and restored cortical vessel network (K and J). Analysis by ANOVA followed by Tukey's post hoc test shows that Timp2 mutation alone has no significant effects on vessel density, but suppresses vessel regression in orc3 mutants (** p<0.01, n = 6) (L). Scale bar (in K): 70 µm for (A–B) and 200 µm for (C–D, G–H, and J–K).

References

    1. Duvernoy HM, Delon S, Vannson JL (1981) Cortical blood vessels of the human brain. Brain Res Bull 7: 519–579. - PubMed
    1. Reina-De La Torre F, Rodriguez-Baeza A, Sahuquillo-Barris J (1998) Morphological characteristics and distribution pattern of the arterial vessels in human cerebral cortex: a scanning electron microscope study. Anat Rec 251: 87–96. - PubMed
    1. Tessier-Lavigne M, Goodman CS (1996) The molecular biology of axon guidance. Science 274: 1123–1133. - PubMed
    1. Reichardt LF (2006) Neurotrophin-regulated signalling pathways. Philos Trans R Soc Lond B Biol Sci 361: 1545–1564. - PMC - PubMed
    1. Carmeliet P, Tessier-Lavigne M (2005) Common mechanisms of nerve and blood vessel wiring. Nature 436: 193–200. - PubMed

Publication types

MeSH terms