. 2013;8(1):e53277.
doi: 10.1371/journal.pone.0053277. Epub 2013 Jan 17.

Phytoplankton-specific response to enrichment of phosphorus-rich surface waters with ammonium, nitrate, and urea

Affiliations

Phytoplankton-specific response to enrichment of phosphorus-rich surface waters with ammonium, nitrate, and urea

Derek B Donald et al. PLoS One. 2013.

Abstract

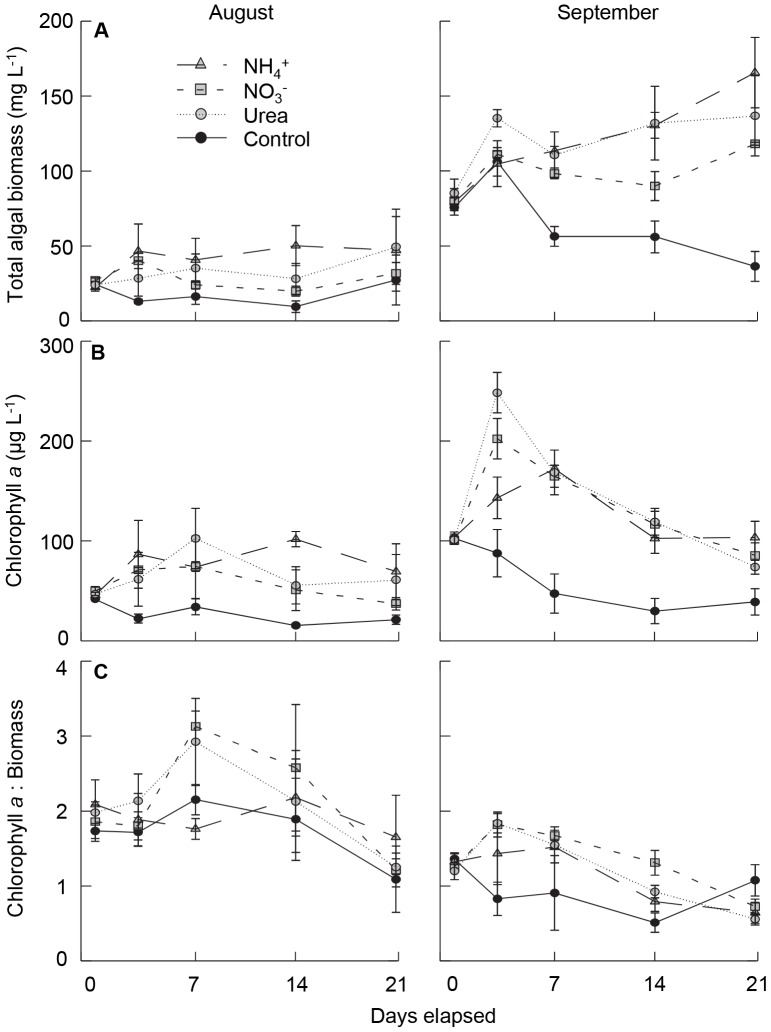
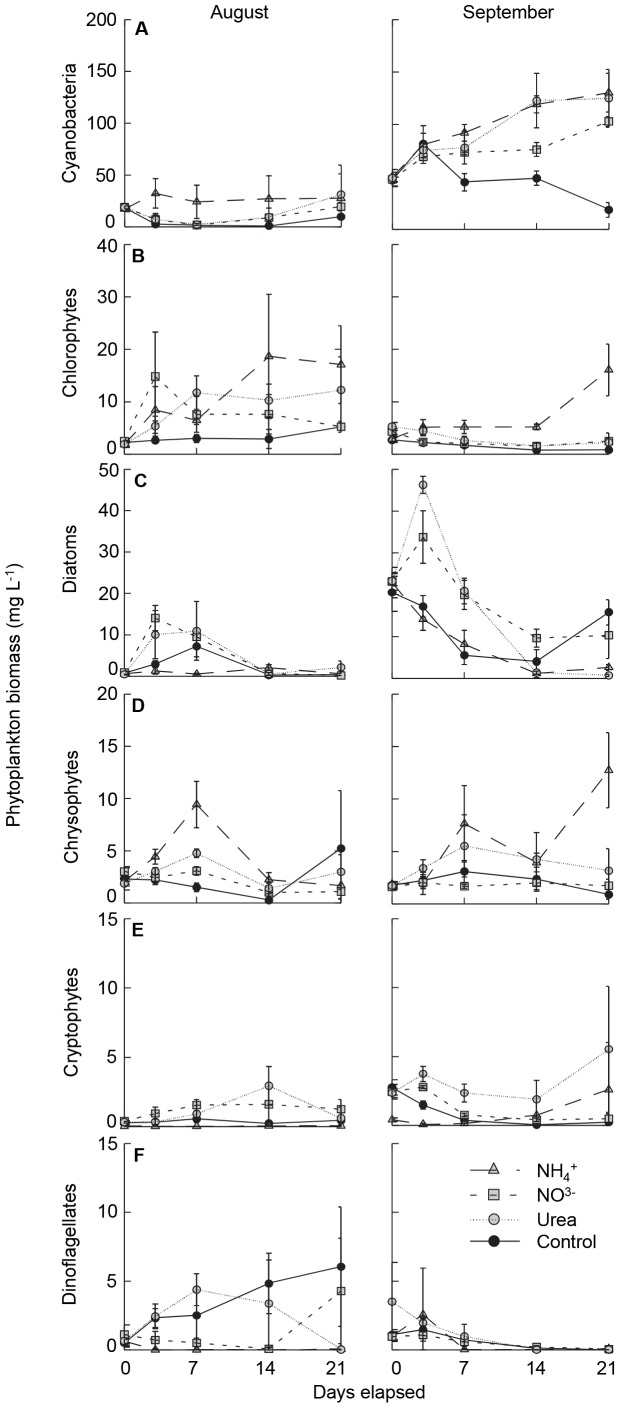
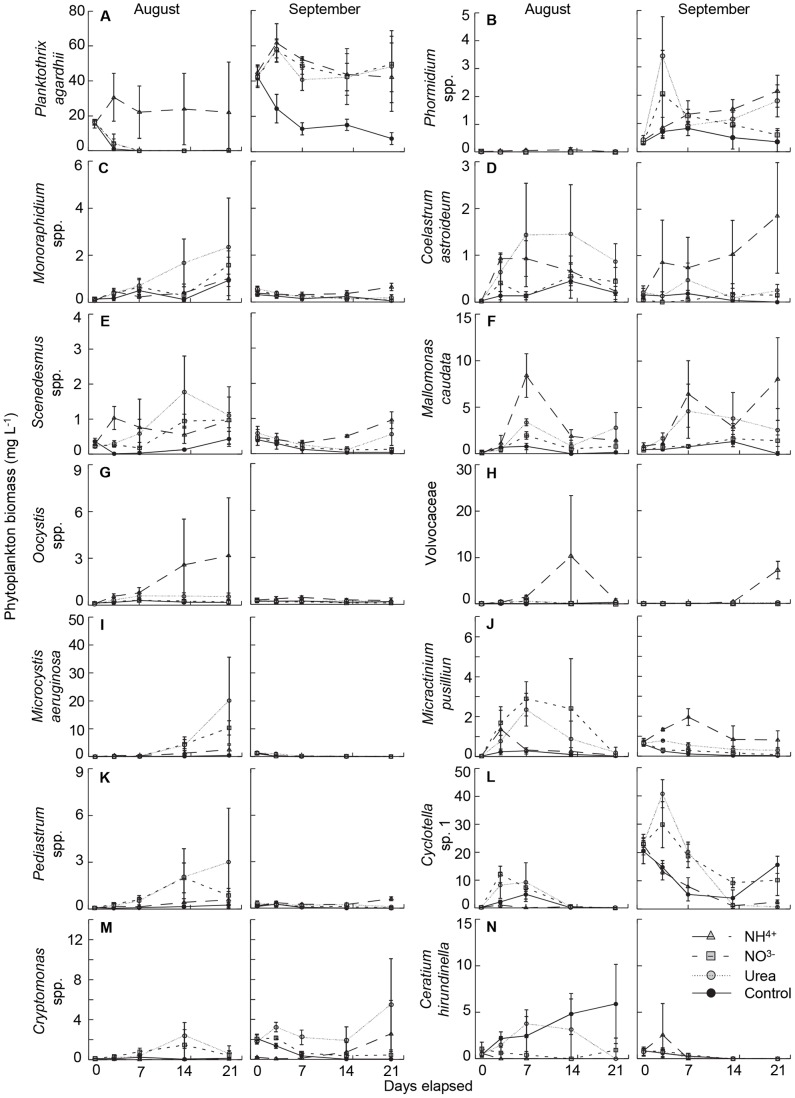
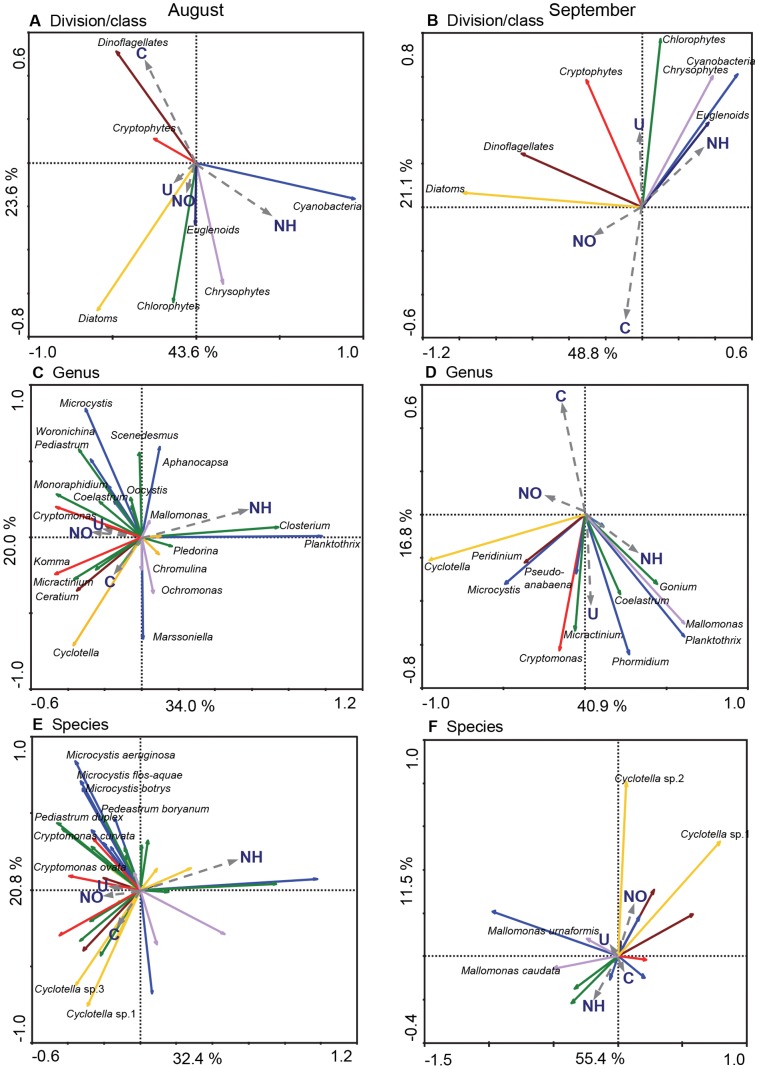
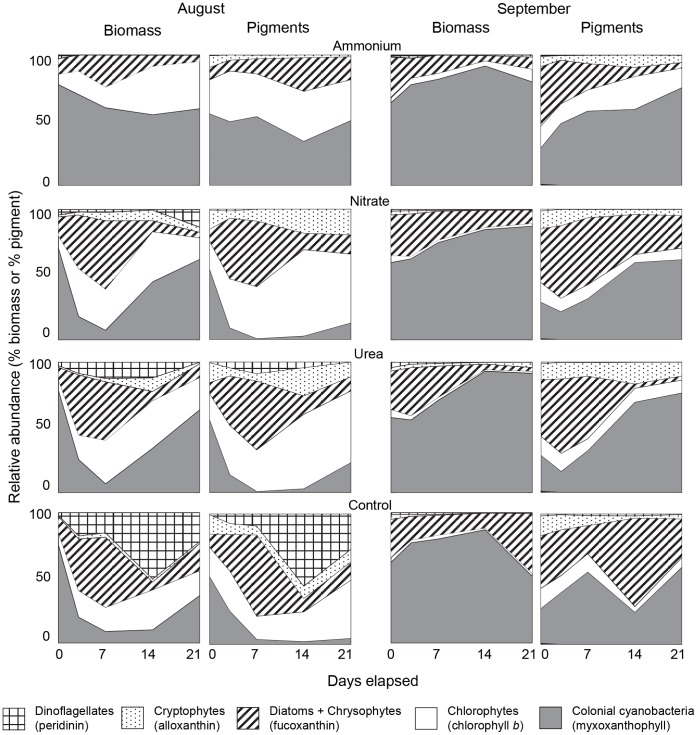
Supply of anthropogenic nitrogen (N) to the biosphere has tripled since 1960; however, little is known of how in situ response to N fertilisation differs among phytoplankton, whether species response varies with the chemical form of N, or how interpretation of N effects is influenced by the method of analysis (microscopy, pigment biomarkers). To address these issues, we conducted two 21-day in situ mesocosm (3140 L) experiments to quantify the species- and genus-specific responses of phytoplankton to fertilisation of P-rich lake waters with ammonium (NH(4)(+)), nitrate (NO(3)(-)), and urea ([NH(2)](2)CO). Phytoplankton abundance was estimated using both microscopic enumeration of cell densities and high performance liquid chromatographic (HPLC) analysis of algal pigments. We found that total algal biomass increased 200% and 350% following fertilisation with NO(3)(-) and chemically-reduced N (NH(4)(+), urea), respectively, although 144 individual taxa exhibited distinctive responses to N, including compound-specific stimulation (Planktothrix agardhii and NH(4)(+)), increased biomass with chemically-reduced N alone (Scenedesmus spp., Coelastrum astroideum) and no response (Aphanizomenon flos-aquae, Ceratium hirundinella). Principle components analyses (PCA) captured 53.2-69.9% of variation in experimental assemblages irrespective of the degree of taxonomic resolution of analysis. PCA of species-level data revealed that congeneric taxa exhibited common responses to fertilisation regimes (e.g., Microcystis aeruginosa, M. flos-aquae, M. botrys), whereas genera within the same division had widely divergent responses to added N (e.g., Anabaena, Planktothrix, Microcystis). Least-squares regression analysis demonstrated that changes in phytoplankton biomass determined by microscopy were correlated significantly (p<0.005) with variations in HPLC-derived concentrations of biomarker pigments (r(2) = 0.13-0.64) from all major algal groups, although HPLC tended to underestimate the relative abundance of cyanobacteria. Together, these findings show that while fertilisation of P-rich lakes with N can increase algal biomass, there is substantial variation in responses of genera and divisions to specific chemical forms of added N.


Conflict of interest statement

Competing Interests: The authors have declared that no competing interests exist.

Figures

Figure 1
Figure 1. Map of Wascana Lake, Saskatchewan, Canada.
Map shows a) the continental location, b) the gross drainage area (1400 km2) and c) depth contour map with the location of the mesocosm experiment (shaded box).
Figure 2
Figure 2. Biomass responses of total algal response to fertilisation with nitrogen in mesocosms conducted in August and September.
Time series include; a) total phytoplankton biomass (mg wet mass L−1), b) Chl a (µg L−1) and c) the ratio of Chl a : total phytoplankton biomass. Symbols represent mean and standard error (± SE, n = 3) for each nitrogen treatment, including amendments with NH4 + (shaded triangle, coarse dashed line), NO3 (shaded square, medium dashed line) and urea (shaded circle, fine dashed line), as well as unamended (control) mesocosms (solid circle, solid line).
Figure 3
Figure 3. Biomass responses of major phytoplankton groups to fertilisation with nitrogen in mesocosms conducted in August and September.
Algal groups (mg wet mass L−1) include; a) cyanobacteria, b) chlorophytes, c) diatoms, d) chrysophytes, e) cryptophytes and f ) dinoflagellates. Symbols represent mean and standard errors (± SE, n = 3) for each of the nitrogen treatments, included amendments with NH4 + (shaded triangle, coarse dashed line), NO3 (shaded square, medium dashed line) and urea (shaded circle, fine dashed line), as well as unamended (control) mesocosms (solid circle, solid line).
Figure 4
Figure 4. Biomass responses of important phytoplankton species to fertilisation with nitrogen in mesocosms conducted in Augusts and September.
Biomass presented as mg wet mass L−1. Symbols represent mean and standard errors (± SE, n = 3) for each of the nitrogen treatments, including addition of NH4 + (shaded triangle, coarse dashed line), NO3 (shaded square, medium dashed line) and urea (shaded circle, fine dashed line), as well as unamended (control) mesocosms (solid circle, solid line).
Figure 5
Figure 5. Principal component analysis of experimental phytoplankton assemblages at the a) division, b) genus, and c) species level of taxonomic resolution.
Genera and species were selected if their cumulative biomass over the course of each experiment was more than 1% of the total for any of the 12 enclosures. Algal densities were log10(x +1)-transformed as needed, and categorical nitrogen treatments (e.g.,+or – urea) were included as passive variables. All samples were included in each PCA; however, to simplify presentation, sample ordination points are not presented and only select taxa are identified. Coloured arrows indicate cyanobacteria (blue), chlorophytes (green), cryptophytes (red), diatoms (yellow), dinoflagellates (brown), and chrysophytes (purple). Proportion of total variation explained by first (x) and second (y) principle axes are presented.
Figure 6
Figure 6. Mean relative abundance of the major phytoplankton groups in the mesocosms subject to addition of nitrogen.
Treatment include addition of ammonium, nitrate, urea and no nitrogen (control) (n = 3). Phytoplankton abundance was determined by microscopic enumeration of biomass and by high performance liquid chromatography of algal pigments in experiments conducted during August and September 2008. Algal groups (and pigments) include dinoflagellates (peridinin), cryptophytes (alloxanthin), diatoms and chrysophytes (fuoxanthin), chlorophytes (chlorophyll b) and colonial cyanobacteria (myxoxanthophyll).

References

    1. Vitousek PM, Aber JD, Howarth RW, Likens GE, Matson PA, et al. (1997) Human alteration of the global nitrogen cycle: Sources and consequences. Ecological Applications 7: 737–750.
    1. Millennium Ecosystem Assessment (2005) Ecosystems and human well-being, vol. 1. Current state and trends: Findings of the condition and trends working group (Millennium Assessment Series). Washiington, DC: Island Press.
    1. Foy RH, Smith RV, Jordan C, Lennox SD (1995) Upward trend in soluble phosphorus loadings to Lough Neagh despite phosphorus reduction at sewage treatment works. Water Research 29: 1051–1063.
    1. Carpenter SR (2005) Eutrophication of aquatic ecosystems: Bistability and soil phosphorus. Proceedings of the National Academy of Sciences of the USA 102: 10002–10005. - PMC - PubMed
    1. MacDonald GK, Bennett EM, Potter PA, Ramankutty N (2011) Agronomic phosphorus imbalances across the world’s croplands. Proceedings of the National Academy of Sciences of the USA 108: 3086–3091. - PMC - PubMed

Publication types

LinkOut - more resources