

Characterization of epicardial-derived cardiac interstitial cells: differentiation and mobilization of heart fibroblast progenitors
- PMID: 23349729
- PMCID: PMC3548895
- DOI: 10.1371/journal.pone.0053694
Characterization of epicardial-derived cardiac interstitial cells: differentiation and mobilization of heart fibroblast progenitors
Abstract
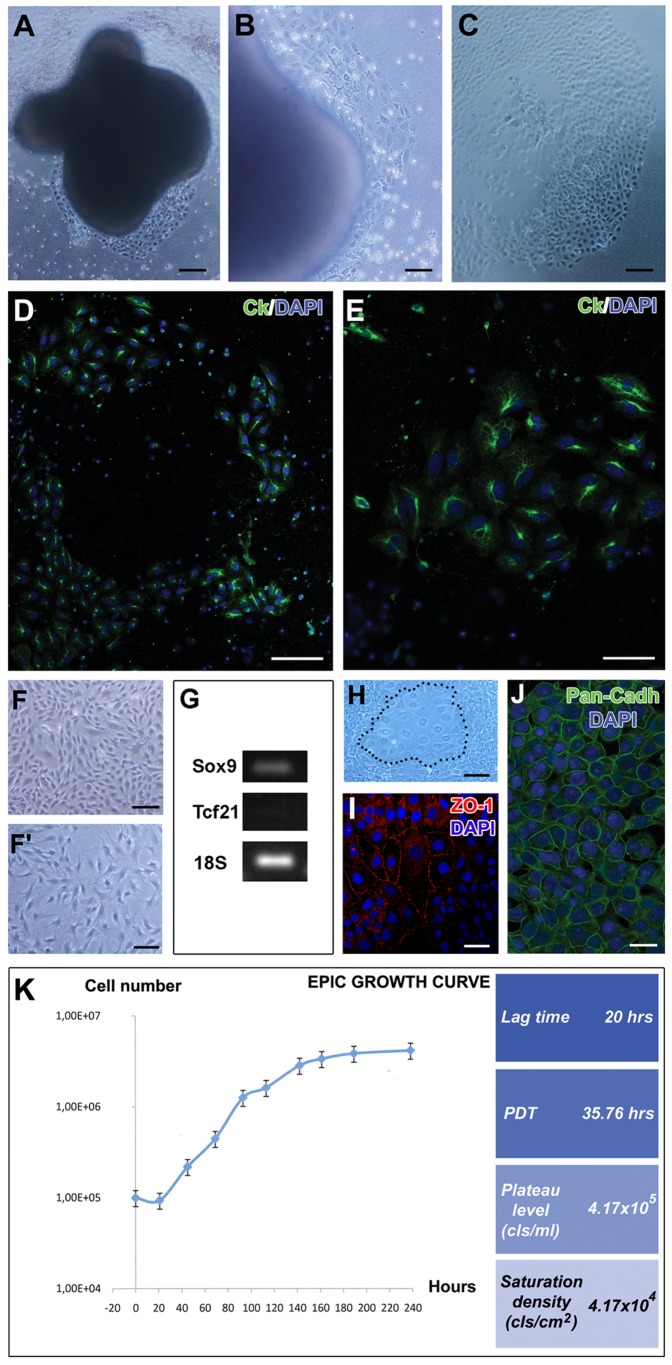
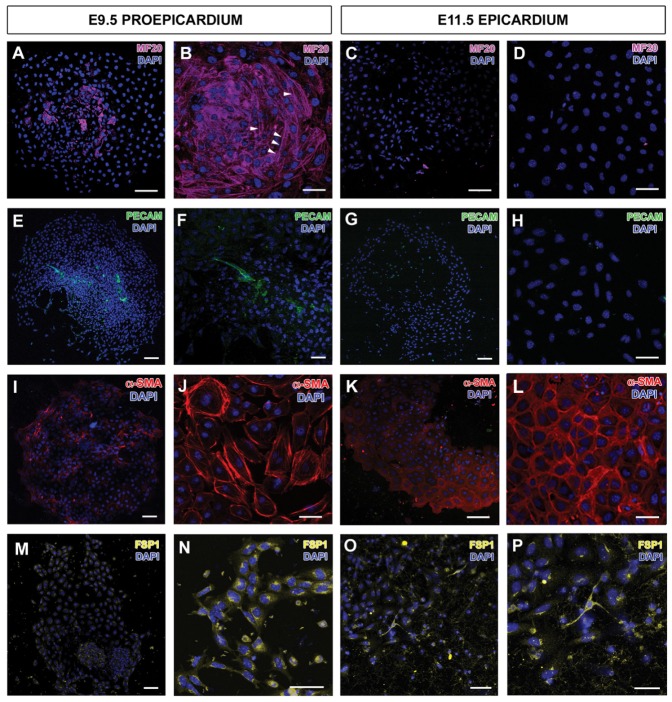
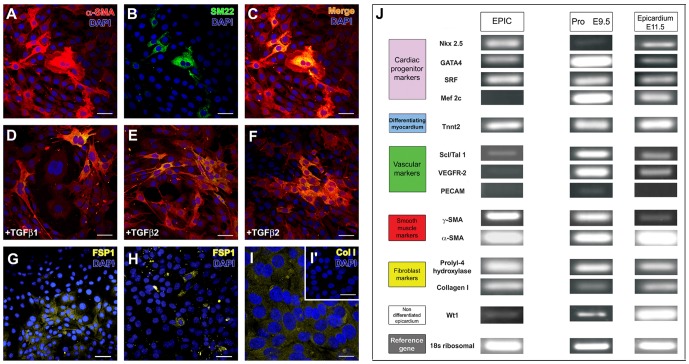
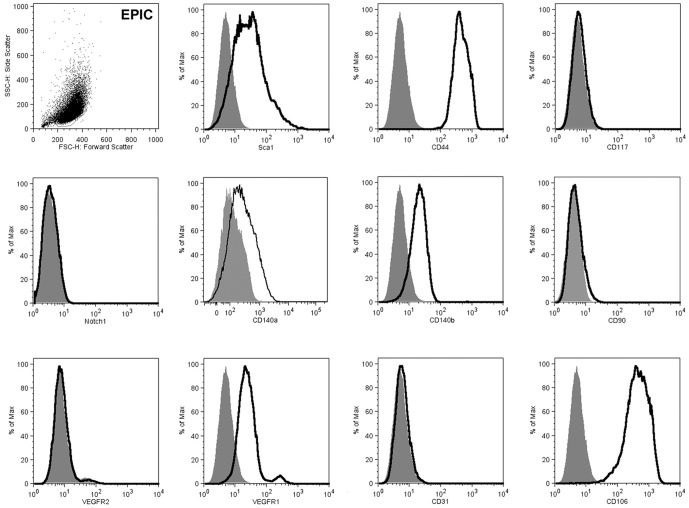
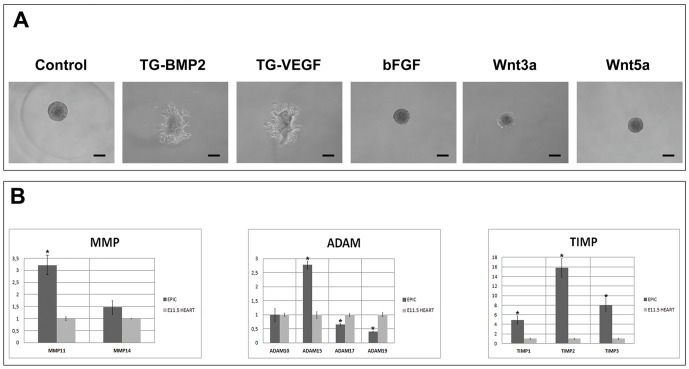
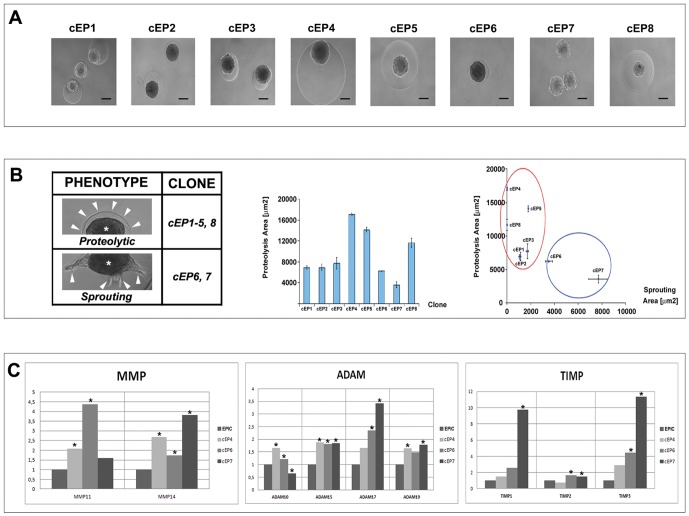
The non-muscular cells that populate the space found between cardiomyocyte fibers are known as 'cardiac interstitial cells' (CICs). CICs are heterogeneous in nature and include different cardiac progenitor/stem cells, cardiac fibroblasts and other cell types. Upon heart damage CICs soon respond by initiating a reparative response that transforms with time into extensive fibrosis and heart failure. Despite the biomedical relevance of CICs, controversy remains on the ontogenetic relationship existing between the different cell kinds homing at the cardiac interstitium, as well as on the molecular signals that regulate their differentiation, maturation, mutual interaction and role in adult cardiac homeostasis and disease. Our work focuses on the analysis of epicardial-derived cells, the first cell type that colonizes the cardiac interstitium. We present here a characterization and an experimental analysis of the differentiation potential and mobilization properties of a new cell line derived from mouse embryonic epicardium (EPIC). Our results indicate that these cells express some markers associated with cardiovascular stemness and retain part of the multipotent properties of embryonic epicardial derivatives, spontaneously differentiating into smooth muscle, and fibroblast/myofibroblast-like cells. Epicardium-derived cells are also shown to initiate a characteristic response to different growth factors, to display a characteristic proteolytic expression profile and to degrade biological matrices in 3D in vitro assays. Taken together, these data indicate that EPICs are relevant to the analysis of epicardial-derived CICs, and are a god model for the research on cardiac fibroblasts and the role these cells play in ventricular remodeling in both ischemic or non/ischemic myocardial disease.
Conflict of interest statement
Figures
Similar articles
-
Differential expression of embryonic epicardial progenitor markers and localization of cardiac fibrosis in adult ischemic injury and hypertensive heart disease.J Mol Cell Cardiol. 2013 Dec;65:108-19. doi: 10.1016/j.yjmcc.2013.10.005. Epub 2013 Oct 17. J Mol Cell Cardiol. 2013. PMID: 24140724 Free PMC article.
-
The arterial and cardiac epicardium in development, disease and repair.Differentiation. 2012 Jul;84(1):41-53. doi: 10.1016/j.diff.2012.05.002. Epub 2012 May 30. Differentiation. 2012. PMID: 22652098 Review.
-
Differentiation of Human Induced Pluripotent Stem Cells into Epicardial-Like Cells.Methods Mol Biol. 2021;2158:141-153. doi: 10.1007/978-1-0716-0668-1_11. Methods Mol Biol. 2021. PMID: 32857371
-
In Vitro Culture of Epicardial Cells From Mouse Embryonic Heart.J Vis Exp. 2016 Apr 27;(110):53993. doi: 10.3791/53993. J Vis Exp. 2016. PMID: 27167492 Free PMC article.
-
Epicardial progenitor cells in cardiac development and regeneration.J Cardiovasc Transl Res. 2012 Oct;5(5):641-53. doi: 10.1007/s12265-012-9377-4. Epub 2012 Jun 1. J Cardiovasc Transl Res. 2012. PMID: 22653801 Review.
Cited by
-
Fibrosis and Fibrotic Gene Expression in Pediatric and Adult Patients With Idiopathic Dilated Cardiomyopathy.J Card Fail. 2017 Apr;23(4):314-324. doi: 10.1016/j.cardfail.2016.11.006. Epub 2016 Nov 24. J Card Fail. 2017. PMID: 27890770 Free PMC article.
-
Programming and reprogramming a human heart cell.EMBO J. 2015 Mar 12;34(6):710-38. doi: 10.15252/embj.201490563. Epub 2015 Feb 20. EMBO J. 2015. PMID: 25712211 Free PMC article. Review.
-
Recapitulating porcine cardiac development in vitro: from expanded potential stem cell to embryo culture models.Front Cell Dev Biol. 2023 May 15;11:1111684. doi: 10.3389/fcell.2023.1111684. eCollection 2023. Front Cell Dev Biol. 2023. PMID: 37261075 Free PMC article.
-
The Epicardium and the Development of the Atrioventricular Junction in the Murine Heart.J Dev Biol. 2014 Mar 1;2(1):1-17. doi: 10.3390/jdb2010001. J Dev Biol. 2014. PMID: 24926431 Free PMC article.
-
Epicardium-Derived Cells Formed After Myocardial Injury Display Phagocytic Activity Permitting In Vivo Labeling and Tracking.Stem Cells Transl Med. 2016 May;5(5):639-50. doi: 10.5966/sctm.2015-0159. Epub 2016 Apr 7. Stem Cells Transl Med. 2016. PMID: 27057005 Free PMC article.
References
-
- Vliegen HW, van der Laarse A, Cornelisse CJ, Eulderink F (1991) Myocardial changes in pressure overload-induced left ventricular hypertrophy. A study on tissue composition, polyploidization and multinucleation. Eur Heart J 12: 488–494. - PubMed
-
- Kanekar S, Hirozanne T, Terracio L, Borg TK (1998) Cardiac fibroblasts: Form and Function. Cardiovasc Pathol 7: 127–133. - PubMed
-
- Jessup M, Brozena S (2003) Heart failure. N Engl J Med 348: 2007–2018. - PubMed
-
- Spinale FG (2007) Myocardial matrix remodeling and the matrix metalloproteinases: Influence on cardiac form and function. Physiol Rev 87: 1285–1342. - PubMed
Publication types
MeSH terms
Substances
LinkOut - more resources
Full Text Sources
Other Literature Sources
Molecular Biology Databases
