

Efficient and comprehensive representation of uniqueness for next-generation sequencing by minimum unique length analyses
- PMID: 23349747
- PMCID: PMC3548888
- DOI: 10.1371/journal.pone.0053822
Efficient and comprehensive representation of uniqueness for next-generation sequencing by minimum unique length analyses
Abstract
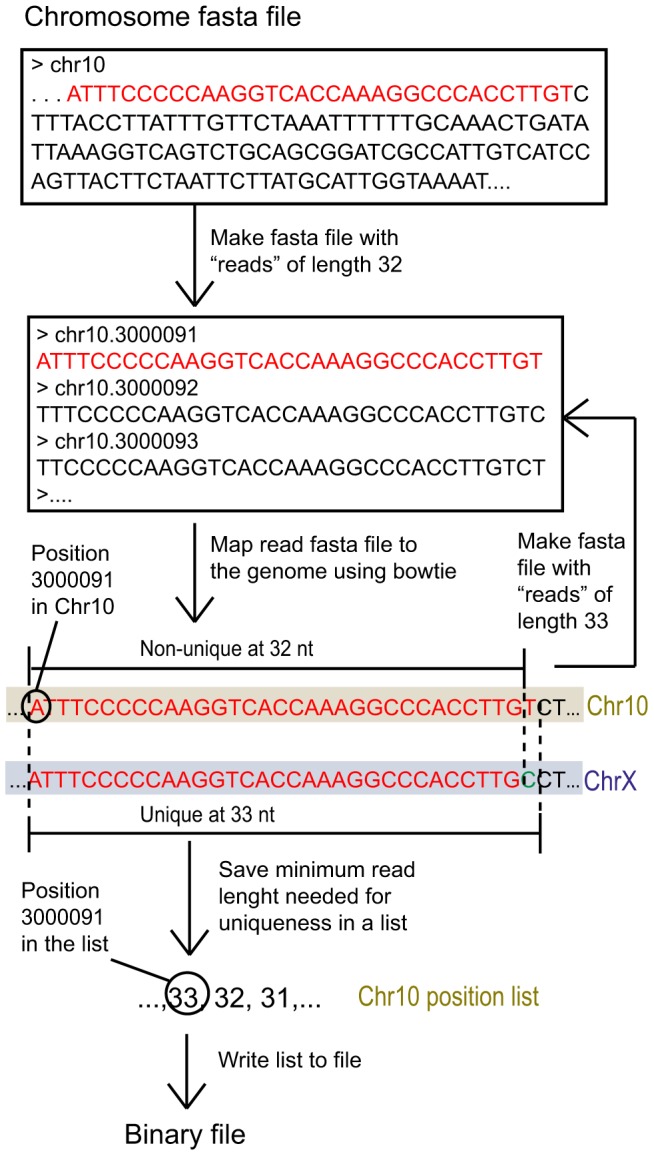
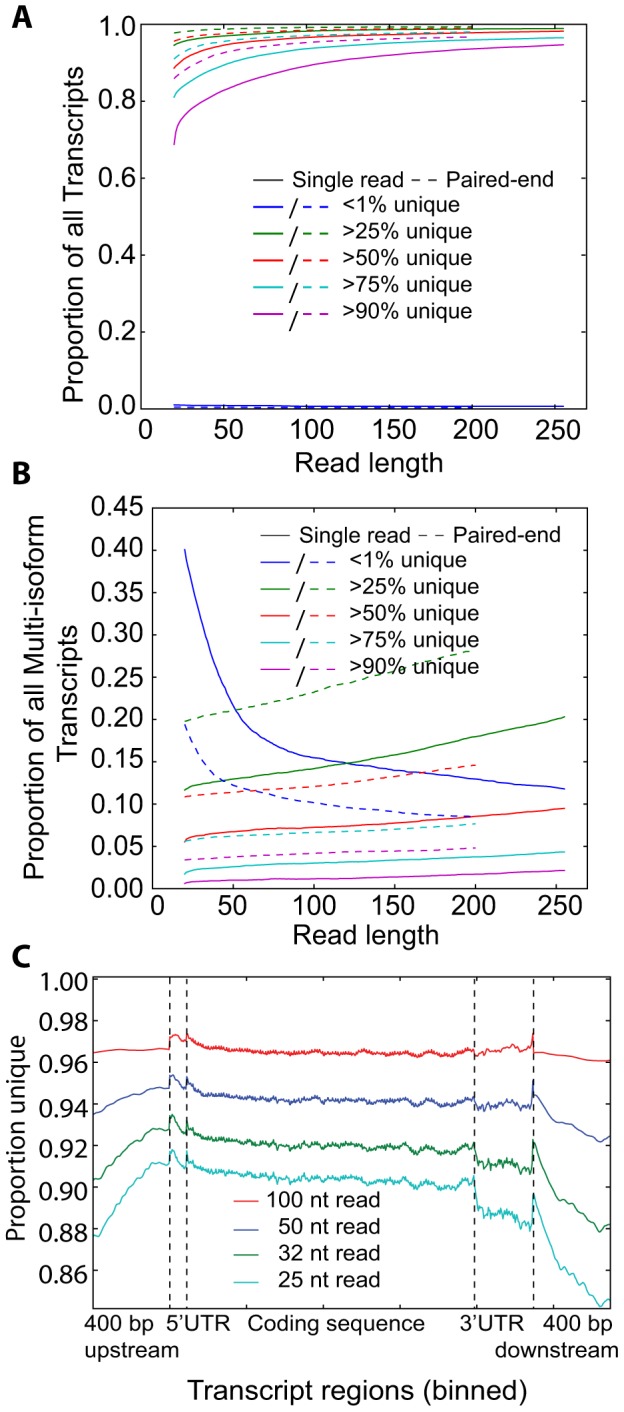
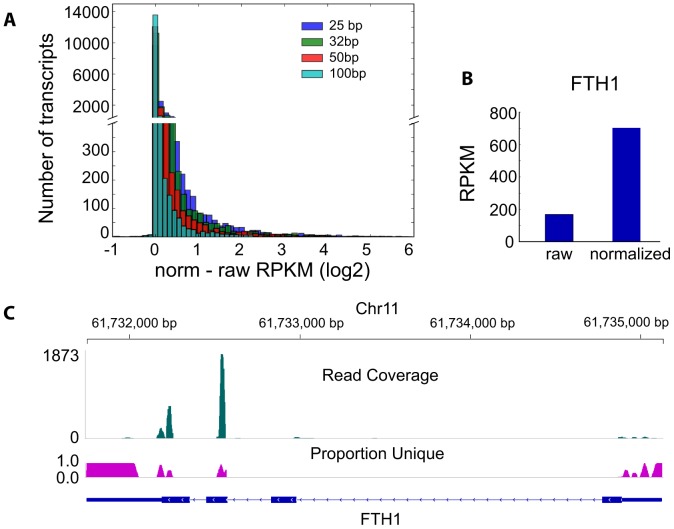
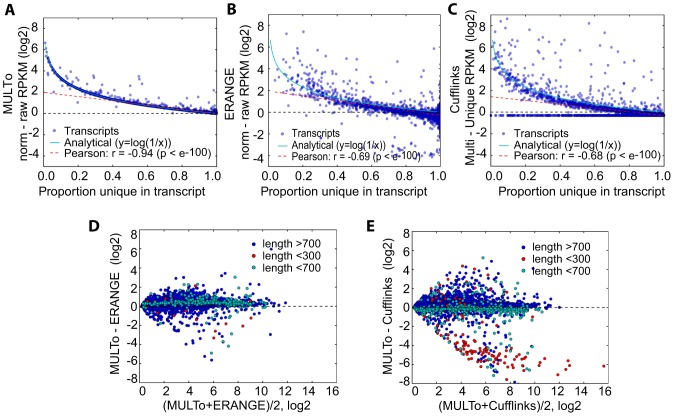
As next generation sequencing technologies are getting more efficient and less expensive, RNA-Seq is becoming a widely used technique for transcriptome studies. Computational analysis of RNA-Seq data often starts with the mapping of millions of short reads back to the genome or transcriptome, a process in which some reads are found to map equally well to multiple genomic locations (multimapping reads). We have developed the Minimum Unique Length Tool (MULTo), a framework for efficient and comprehensive representation of mappability information, through identification of the shortest possible length required for each genomic coordinate to become unique in the genome and transcriptome. Using the minimum unique length information, we have compared different uniqueness compensation approaches for transcript expression level quantification and demonstrate that the best compensation is achieved by discarding multimapping reads and correctly adjusting gene model lengths. We have also explored uniqueness within specific regions of the mouse genome and enhancer mapping experiments. Finally, by making MULTo available to the community we hope to facilitate the use of uniqueness compensation in RNA-Seq analysis and to eliminate the need to make additional mappability files.
Conflict of interest statement
Figures
Similar articles
-
Next-generation sequencing facilitates quantitative analysis of wild-type and Nrl(-/-) retinal transcriptomes.Mol Vis. 2011;17:3034-54. Epub 2011 Nov 23. Mol Vis. 2011. PMID: 22162623 Free PMC article.
-
SPARTA: Simple Program for Automated reference-based bacterial RNA-seq Transcriptome Analysis.BMC Bioinformatics. 2016 Feb 4;17:66. doi: 10.1186/s12859-016-0923-y. BMC Bioinformatics. 2016. PMID: 26847232 Free PMC article.
-
Efficient assembly and annotation of the transcriptome of catfish by RNA-Seq analysis of a doubled haploid homozygote.BMC Genomics. 2012 Nov 5;13:595. doi: 10.1186/1471-2164-13-595. BMC Genomics. 2012. PMID: 23127152 Free PMC article.
-
Mapping RNA-seq Reads with STAR.Curr Protoc Bioinformatics. 2015 Sep 3;51:11.14.1-11.14.19. doi: 10.1002/0471250953.bi1114s51. Curr Protoc Bioinformatics. 2015. PMID: 26334920 Free PMC article. Review.
-
Genome-guided transcriptome assembly in the age of next-generation sequencing.IEEE/ACM Trans Comput Biol Bioinform. 2013 Sep-Oct;10(5):1234-40. doi: 10.1109/tcbb.2013.140. IEEE/ACM Trans Comput Biol Bioinform. 2013. PMID: 24524156 Free PMC article. Review.
Cited by
-
m5C-Atlas: a comprehensive database for decoding and annotating the 5-methylcytosine (m5C) epitranscriptome.Nucleic Acids Res. 2022 Jan 7;50(D1):D196-D203. doi: 10.1093/nar/gkab1075. Nucleic Acids Res. 2022. PMID: 34986603 Free PMC article.
-
Mammalian NET-seq analysis defines nascent RNA profiles and associated RNA processing genome-wide.Nat Protoc. 2016 Mar;11(3):413-28. doi: 10.1038/nprot.2016.012. Epub 2016 Feb 4. Nat Protoc. 2016. PMID: 26844429 Free PMC article.
-
The in vivo dynamics of antigenic variation in Trypanosoma brucei.Science. 2015 Mar 27;347(6229):1470-3. doi: 10.1126/science.aaa4502. Science. 2015. PMID: 25814582 Free PMC article.
-
Characterizing crosstalk in epigenetic signaling to understand disease physiology.Biochem J. 2023 Jan 13;480(1):57-85. doi: 10.1042/BCJ20220550. Biochem J. 2023. PMID: 36630129 Free PMC article.
-
Molecular and functional heterogeneity of IL-10-producing CD4+ T cells.Nat Commun. 2018 Dec 21;9(1):5457. doi: 10.1038/s41467-018-07581-4. Nat Commun. 2018. PMID: 30575716 Free PMC article.
References
-
- Metzker ML (2010) Sequencing technologies - the next generation. Nature Reviews Genetics 11: 31–46 Available: http://www.ncbi.nlm.nih.gov/pubmed/19997069. - PubMed
-
- Mortazavi A, Williams B, McCue K, Schaeffer L, Wold B (2008) Mapping and quantifying mammalian transcriptomes by RNA-Seq. Nat Methods Available: http://www.nature.com/nmeth/journal/vaop/ncurrent/abs/nmeth.1226.html. - PubMed
-
- Wang ET, Sandberg R, Luo S, Khrebtukova I, Zhang L, et al. (2008) Alternative isoform regulation in human tissue transcriptomes. Nature 456: 470–476 Available: http://www.nature.com/nature/journal/v456/n7221/abs/nature07509.html. - PMC - PubMed
-
- Pan Q, Shai O, Lee LJ, Frey BJ, Blencowe BJ (2008) Deep surveying of alternative splicing complexity in the human transcriptome by high-throughput sequencing. Nature Genetics 40: 1413–1415 Available: http://www.ncbi.nlm.nih.gov/pubmed/18978789. - PubMed
-
- Lee S, Seo CH, Lim B, Yang JO, Oh J, et al. (2011) Accurate quantification of transcriptome from RNA-Seq data by effective length normalization. Nucleic Acids Research 39: e9 Available: http://www.ncbi.nlm.nih.gov/pubmed/21059678. - PMC - PubMed
Publication types
MeSH terms
Substances
LinkOut - more resources
Full Text Sources
Other Literature Sources
Research Materials
