. 2013;8(1):e53963.
doi: 10.1371/journal.pone.0053963. Epub 2013 Jan 21.

FIM, a novel FTIR-based imaging method for high throughput locomotion analysis

Affiliations

FIM, a novel FTIR-based imaging method for high throughput locomotion analysis

Benjamin Risse et al. PLoS One. 2013.

Abstract

We designed a novel imaging technique based on frustrated total internal reflection (FTIR) to obtain high resolution and high contrast movies. This FTIR-based Imaging Method (FIM) is suitable for a wide range of biological applications and a wide range of organisms. It operates at all wavelengths permitting the in vivo detection of fluorescent proteins. To demonstrate the benefits of FIM, we analyzed large groups of crawling Drosophila larvae. The number of analyzable locomotion tracks was increased by implementing a new software module capable of preserving larval identity during most collision events. This module is integrated in our new tracking program named FIMTrack which subsequently extracts a number of features required for the analysis of complex locomotion phenotypes. FIM enables high throughput screening for even subtle behavioral phenotypes. We tested this newly developed setup by analyzing locomotion deficits caused by the glial knockdown of several genes. Suppression of kinesin heavy chain (khc) or rab30 function led to contraction pattern or head sweeping defects, which escaped in previous analysis. Thus, FIM permits forward genetic screens aimed to unravel the neural basis of behavior.


Conflict of interest statement

Competing Interests: The authors have declared that no competing interests exist.

Figures

Figure 1
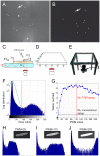
Figure 1. The FIM setup.
(A) Image of 10 larvae (arrow) imaged in a conventional setup. The asterisks denote scratches and reflections in the tracking surface. (B) Image of 10 larvae (arrow) imaged in the FIM setup. Note the high contrast. (C) The principle of frustrated total internal reflection. n1 to n3 indicate different refractory indices, an acrylic glass plate is flooded with infrared light (indicated by red lines). The camera is mounted below the tracking table. (D) Schematic drawing of the setup. (E) Image of the tracking table. (F) Histogram of the image shown in (b). (G) Comparison of Weber contrast (Wc) obtained in the conventional and the FIM setup. The pulse-width modulation (PWM) is plotted against the Weber contrast. (H–J) Histogram taken at different PWM values as indicated.
Figure 2
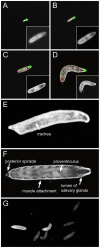
Figure 2. Recognition of inner structures.
(A–D) Comparison of spatial resolution at different tracking arena sizes. The image shows the output of the tracker in true resolution. The green dot demarcates the moving tip of the animal. In the inlay the larvae are magnified to comparable sizes to show the spatial resolution. (A) Arena of 42.5 cm×42.5 cm; the size of a third instar larvae is 25 pixel per larval length. No automatic head recognition is possible. (B) Arena of 25 cm×25 cm; the size of a third instar larvae is 40 pixel. In about 60% of all frames the head can be identified. (C) Arena of 13 cm×13 cm; the size of a third instar larvae is 75 pixel. In 98% of all frames the head can be recognized. (d) Arena of 6 cm×6 cm; the size of a third instar larvae is 170 pixel. (E,F) Two 170 pixel images demonstrating the high resolution of FIM. Several inner structures are indicated. (G) Screen shot of a movie taken with illumination by 470 nm LEDs, seven larvae are shown, two of which express daGal4 driven GFP.
Figure 3
Figure 3. FIM-imaging allows extraction of several features.
(A) Two larvae are shown in the 170 pixel per larval length resolution. The different features extracted are indicated. The spine is indicated by a white line. On the spine seven landmarks are positioned. The head (green dot), the center (red dot) and the tail (blue dot) are indicated. The contour line (yellow) and the bending angle φ are shown. (B) Plot of different group sizes against the percentage of completely tracked paths. The number of larvae tracked (n) is indicated. Recording for 3 minutes at 10 fps and 40 pixel larval length resolution. (C–H) Examples of larval collisions. (C–E) Moderately touching larvae can be separated. (F–H) In case of more intensive collision, the separation of larval contours is not perfect. (I) Stills of a movie showing a larval contraction wave. The numbers indicate the frames shown in (J). (J) The area covered by a larvae changes during contraction. Asterisks indicate the positions of the images shown in (I).
Figure 4
Figure 4. Glial suppression of khc reduces contractibility.
(A) MDS analysis of area sizes (area1800 to area2) of individual larvae expressing khc dsRNA (green circles) or Orco dsRNA (blue circles) in all glial cells. (B) Discretized distribution of mean area sizes. The panglial knockdown of khc leads to bigger larvae. (C,D) Plot of area changes over time. (C) Panglial knockdown of Orco. (D) Panglial knockdown of khc. (E) Discretized contraction intensity intervals plotted against the mean contraction intensity. Upon khc knockdown reduced contraction intensity is observed.
Figure 5
Figure 5. Glial suppression of rab30 increases head bending intensity and frequency.
(A) MDS analysis of bending angles (angle1800 to angle2) of individual larvae expressing rab30 dsRNA (red circles) or Orco dsRNA (blue circles) in all glial cells. (B) Plot of mean bending rate (left vs. right) for every animal. A turning tendency to the right can be seen. (C) Plot of bending angle threshold against mean bending rate per genotype. (D) Trajectories of larvae upon glial suppression of Orco (blue) and rab30 (red).

Similar articles

Cited by

References

    1. Venken KJT, Simpson JH, Bellen HJ (2011) Genetic manipulation of genes and cells in the nervous system of the fruit fly. Neuron 72: 202–230. - PMC - PubMed
    1. Gomez-Marin A, Stephens GJ, Louis M (2011) Active sampling and decision making in Drosophila chemotaxis. Nat Commun 2: 441. - PMC - PubMed
    1. Maimon G, Straw AD, Dickinson MH (2008) A simple vision-based algorithm for decision making in flying Drosophila. Curr Biol 18: 464–470. - PubMed
    1. Frye MA, Dickinson MH (2004) Closing the loop between neurobiology and flight behavior in Drosophila. Curr Opin Neurobiol 14: 729–736. - PubMed
    1. Fry SN, Sayaman R, Dickinson MH (2003) The aerodynamics of free-flight maneuvers in Drosophila. Science 300: 495–498. - PubMed

Publication types

LinkOut - more resources