

Protein kinase C regulates human pluripotent stem cell self-renewal
- PMID: 23349801
- PMCID: PMC3549959
- DOI: 10.1371/journal.pone.0054122
Protein kinase C regulates human pluripotent stem cell self-renewal
Abstract
Background: The self-renewal of human pluripotent stem (hPS) cells including embryonic stem and induced pluripotent stem cells have been reported to be supported by various signal pathways. Among them, fibroblast growth factor-2 (FGF-2) appears indispensable to maintain self-renewal of hPS cells. However, downstream signaling of FGF-2 has not yet been clearly understood in hPS cells.
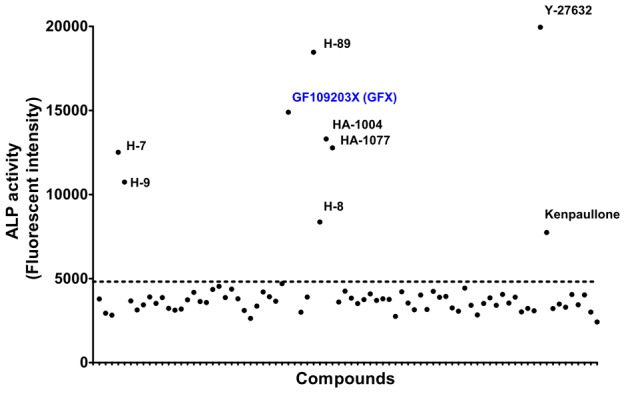
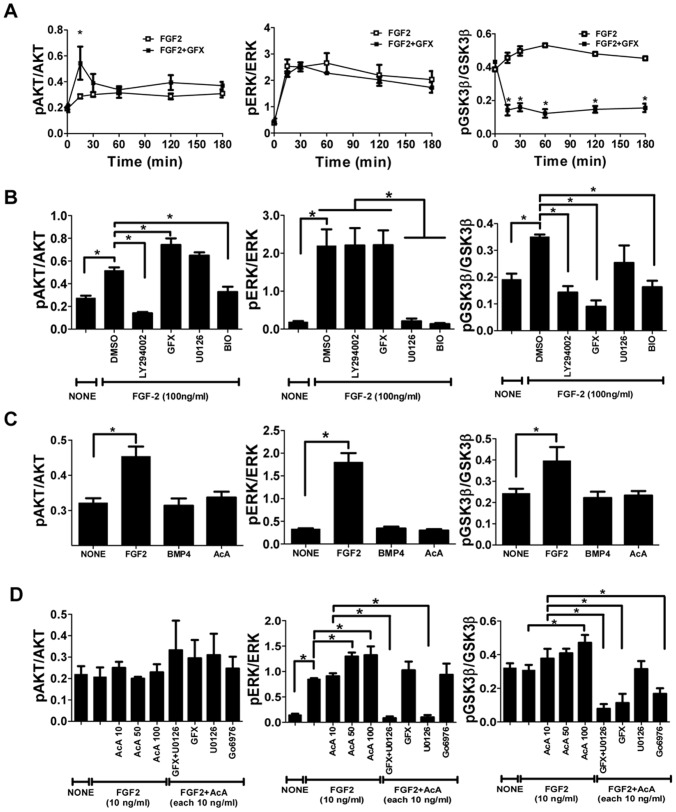
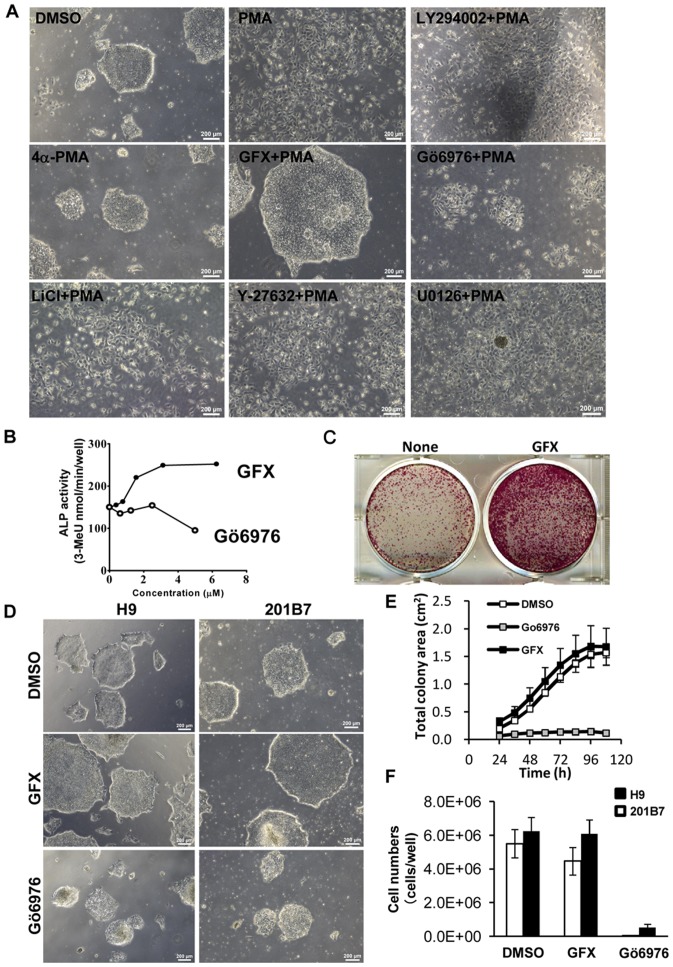
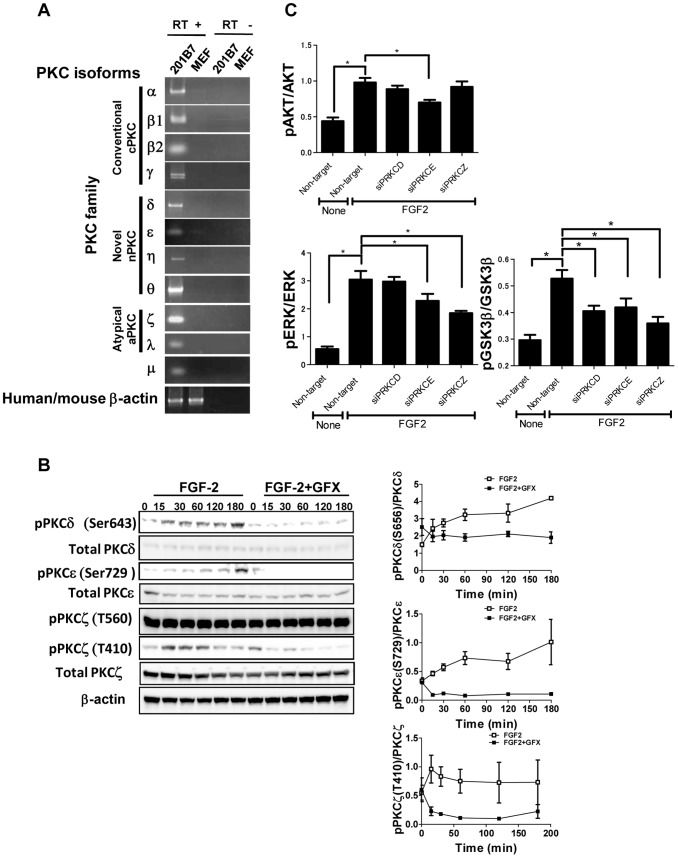
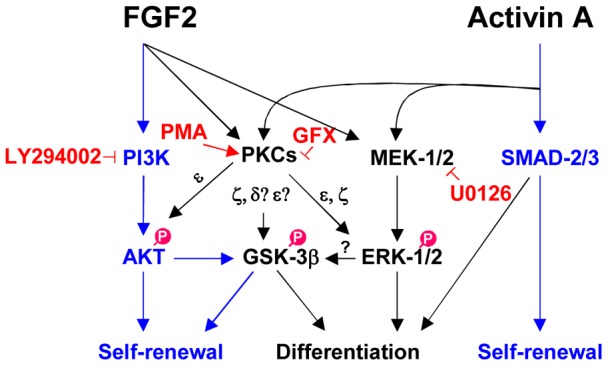
Methodology/principal findings: In this study, we screened a kinase inhibitor library using a high-throughput alkaline phosphatase (ALP) activity-based assay in a minimal growth factor-defined medium to understand FGF-2-related molecular mechanisms regulating self-renewal of hPS cells. We found that in the presence of FGF-2, an inhibitor of protein kinase C (PKC), GF109203X (GFX), increased ALP activity. GFX inhibited FGF-2-induced phosphorylation of glycogen synthase kinase-3β (GSK-3β), suggesting that FGF-2 induced PKC and then PKC inhibited the activity of GSK-3β. Addition of activin A increased phosphorylation of GSK-3β and extracellular signal-regulated kinase-1/2 (ERK-1/2) synergistically with FGF-2 whereas activin A alone did not. GFX negated differentiation of hPS cells induced by the PKC activator, phorbol 12-myristate 13-acetate whereas Gö6976, a selective inhibitor of PKCα, β, and γ isoforms could not counteract the effect of PMA. Intriguingly, functional gene analysis by RNA interference revealed that the phosphorylation of GSK-3β was reduced by siRNA of PKCδ, PKCε, and ζ, the phosphorylation of ERK-1/2 was reduced by siRNA of PKCε and ζ, and the phosphorylation of AKT was reduced by PKCε in hPS cells.
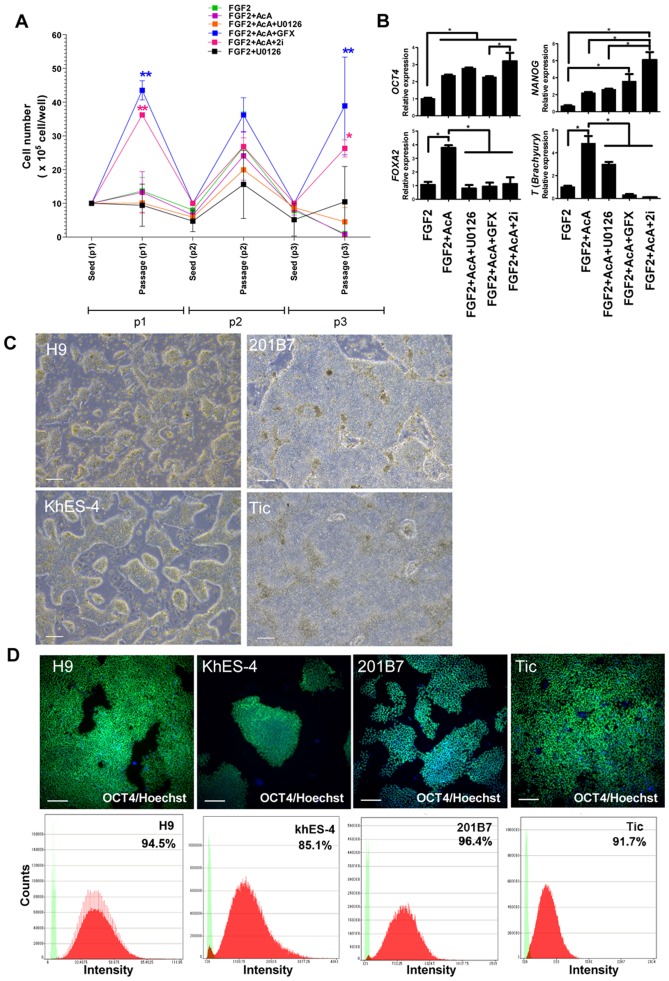
Conclusions/significance: Our study suggested complicated cross-talk in hPS cells that FGF-2 induced the phosphorylation of phosphatidylinositol-3 kinase (PI3K)/AKT, mitogen-activated protein kinase/ERK-1/2 kinase (MEK), PKC/ERK-1/2 kinase, and PKC/GSK-3β. Addition of GFX with a MEK inhibitor, U0126, in the presence of FGF-2 and activin A provided a long-term stable undifferentiated state of hPS cells even though hPS cells were dissociated into single cells for passage. This study untangles the cross-talk between molecular mechanisms regulating self-renewal and differentiation of hPS cells.
Conflict of interest statement
Figures
Similar articles
-
Effect of phorbol ester and platelet-derived growth factor on protein kinase C in rat hepatic stellate cells.Liver Int. 2007 Oct;27(8):1066-75. doi: 10.1111/j.1478-3231.2007.01573.x. Liver Int. 2007. PMID: 17845534
-
Protein kinase C (PKC)-delta/-epsilon mediate the PKC/Akt-dependent phosphorylation of extracellular signal-regulated kinases 1 and 2 in MCF-7 cells stimulated by bradykinin.J Endocrinol. 2006 Jan;188(1):79-89. doi: 10.1677/joe.1.06433. J Endocrinol. 2006. PMID: 16394177
-
Glycogen synthase kinase-3 is a negative regulator of extracellular signal-regulated kinase.Oncogene. 2006 Jan 5;25(1):43-50. doi: 10.1038/sj.onc.1209004. Oncogene. 2006. PMID: 16278684 Free PMC article.
-
Signaling networks in human pluripotent stem cells.Curr Opin Cell Biol. 2013 Apr;25(2):241-6. doi: 10.1016/j.ceb.2012.09.005. Epub 2012 Oct 22. Curr Opin Cell Biol. 2013. PMID: 23092754 Free PMC article. Review.
-
The ground state of pluripotency.Biochem Soc Trans. 2010 Aug;38(4):1027-32. doi: 10.1042/BST0381027. Biochem Soc Trans. 2010. PMID: 20658998 Review.
Cited by
-
Development of a Monitoring Method for Nonlabeled Human Pluripotent Stem Cell Growth by Time-Lapse Image Analysis.Stem Cells Transl Med. 2015 Jul;4(7):720-30. doi: 10.5966/sctm.2014-0242. Epub 2015 May 13. Stem Cells Transl Med. 2015. PMID: 25972146 Free PMC article.
-
Inhibition of PKCε induces primordial germ cell reprogramming into pluripotency by HIF1&2 upregulation and histone acetylation.Am J Stem Cells. 2021 Feb 15;10(1):1-17. eCollection 2021. Am J Stem Cells. 2021. PMID: 33815934 Free PMC article.
-
Synergistic effects of FGF-2 and Activin A on early neural differentiation of human pluripotent stem cells.In Vitro Cell Dev Biol Anim. 2015 Sep;51(8):769-75. doi: 10.1007/s11626-015-9909-8. Epub 2015 Apr 22. In Vitro Cell Dev Biol Anim. 2015. PMID: 25898826
-
Controlled release of basic fibroblast growth factor from a water-floatable polyethylene nonwoven fabric sheet for maintenance culture of iPSCs.RSC Adv. 2019 Dec 23;10(1):95-104. doi: 10.1039/c9ra06906b. eCollection 2019 Dec 20. RSC Adv. 2019. PMID: 35492512 Free PMC article.
-
The Encyclopedia of Proteome Dynamics: the KinoViewer.Bioinformatics. 2019 Apr 15;35(8):1441-1442. doi: 10.1093/bioinformatics/bty823. Bioinformatics. 2019. PMID: 30239567 Free PMC article.
References
-
- Vallier L, Reynolds D, Pedersen RA (2004) Nodal inhibits differentiation of human embryonic stem cells along the neuroectodermal default pathway. Dev. Biol 275: 403–421. - PubMed
-
- Vallier L, Alexander M, Pedersen RA (2005) Activin/Nodal and FGF pathways cooperate to maintain pluripotency of human embryonic stem cells. J Cell Science 118: 4495–4509. - PubMed
-
- James D, Levine AJ, Besser D, Hemmati-Brivanlou A (2005) TGFβ/activin/nodal signaling is necessary for the maintenance of pluripotency in human embryonic stem cells. Development 132: 1273–1282. - PubMed
-
- Pebay A, Wong RC, Pitson SM, Wolvetang EJ, Peh GS, et al. (2005) Essential roles of sphingosine-1-phosphate and platelet-derived growth factor in the maintenance of human embryonic stem cells. Stem Cells 23: 1541–1548. - PubMed
-
- Bendall SC, Stewart MH, Menendez P, George D, Vijayaragavan K, et al. (2007) IGF and FGF cooperatively establish the regulatory stem cell niche of pluripotent human cells in vitro. Nature 448: 1015–1021. - PubMed
Publication types
MeSH terms
Substances
LinkOut - more resources
Full Text Sources
Other Literature Sources
Miscellaneous
