

Chemotaxis of Dictyostelium discoideum: collective oscillation of cellular contacts
- PMID: 23349816
- PMCID: PMC3547869
- DOI: 10.1371/journal.pone.0054172
Chemotaxis of Dictyostelium discoideum: collective oscillation of cellular contacts
Abstract
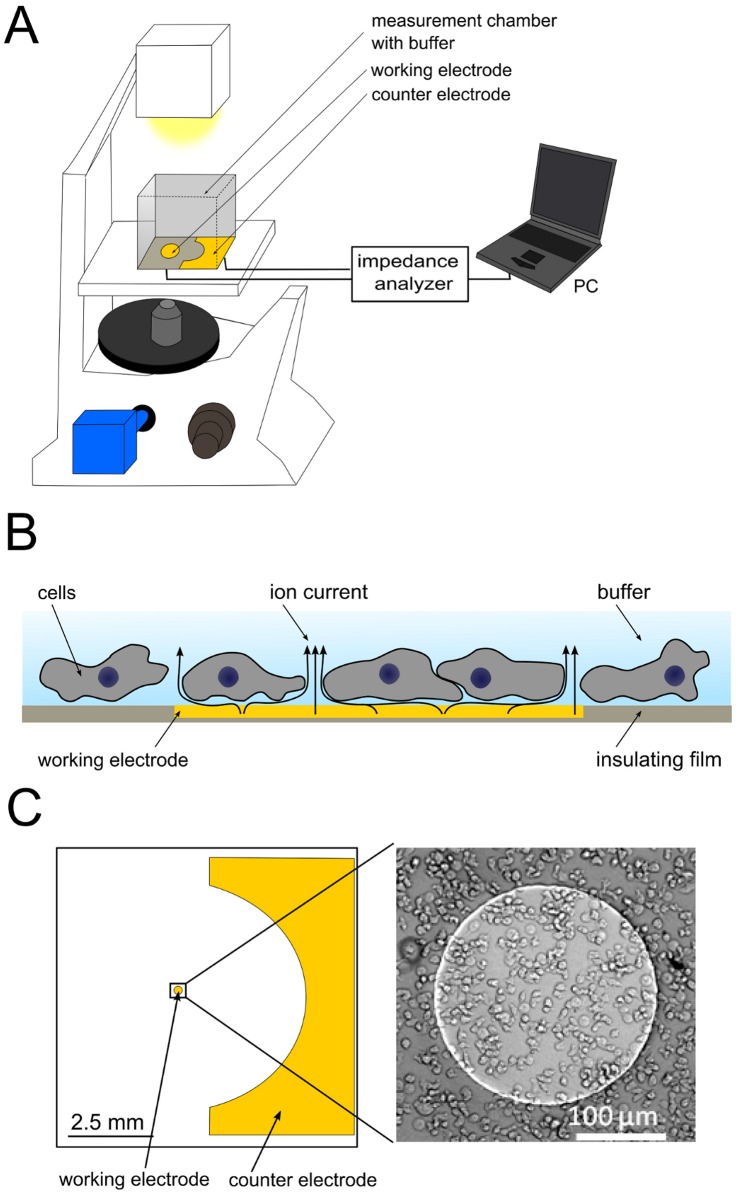
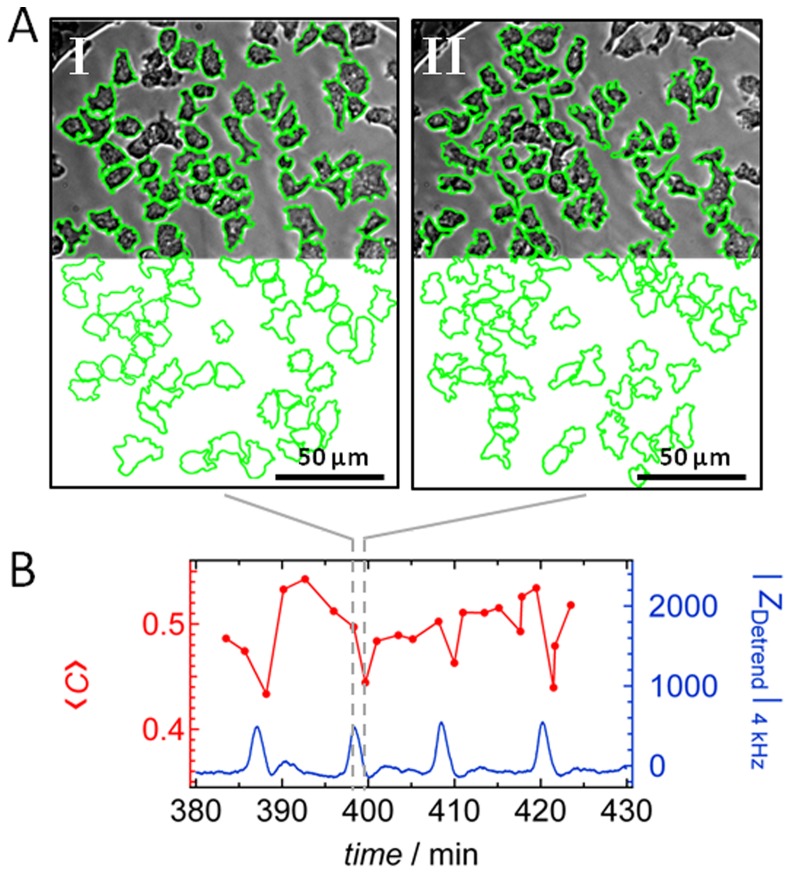
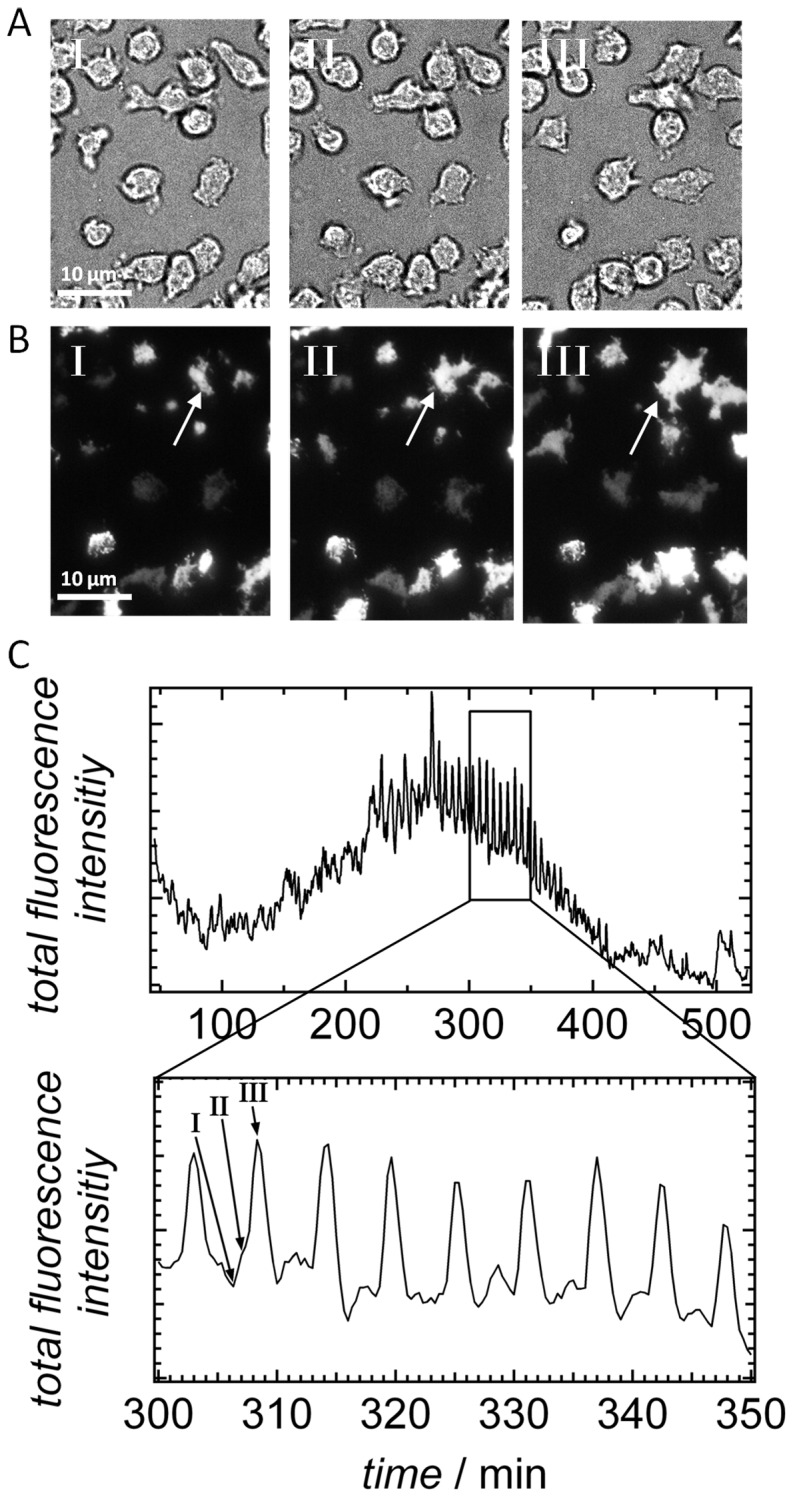
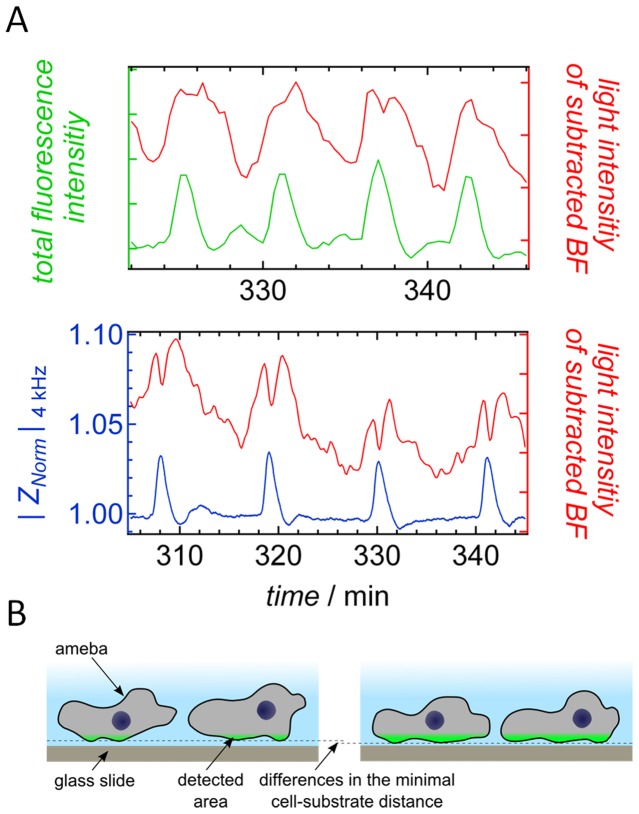
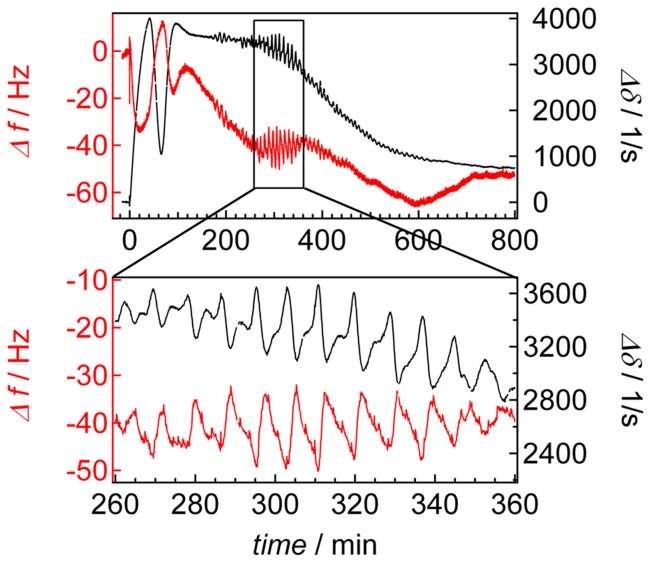
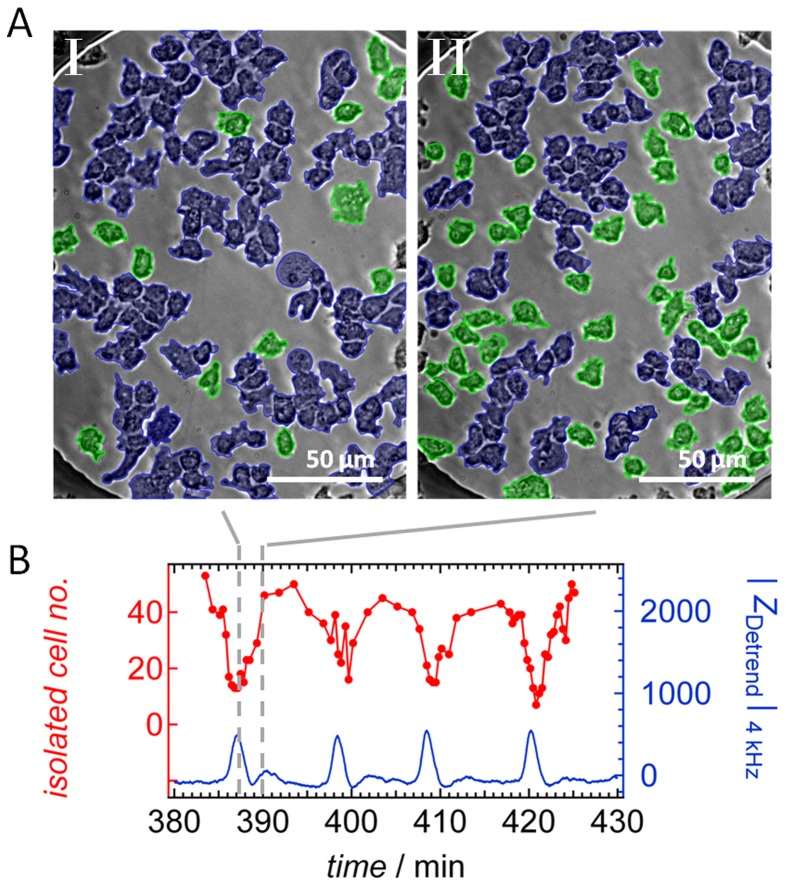
Chemotactic responses of Dictyostelium discoideum cells to periodic self-generated signals of extracellular cAMP comprise a large number of intricate morphological changes on different length scales. Here, we scrutinized chemotaxis of single Dictyostelium discoideum cells under conditions of starvation using a variety of optical, electrical and acoustic methods. Amebas were seeded on gold electrodes displaying impedance oscillations that were simultaneously analyzed by optical video microscopy to relate synchronous changes in cell density, morphology, and distance from the surface to the transient impedance signal. We found that starved amebas periodically reduce their overall distance from the surface producing a larger impedance and higher total fluorescence intensity in total internal reflection fluorescence microscopy. Therefore, we propose that the dominant sources of the observed impedance oscillations observed on electric cell-substrate impedance sensing electrodes are periodic changes of the overall cell-substrate distance of a cell. These synchronous changes of the cell-electrode distance were also observed in the oscillating signal of acoustic resonators covered with amebas. We also found that periodic cell-cell aggregation into transient clusters correlates with changes in the cell-substrate distance and might also contribute to the impedance signal. It turned out that cell-cell contacts as well as cell-substrate contacts form synchronously during chemotaxis of Dictyostelium discoideum cells.
Conflict of interest statement
Figures
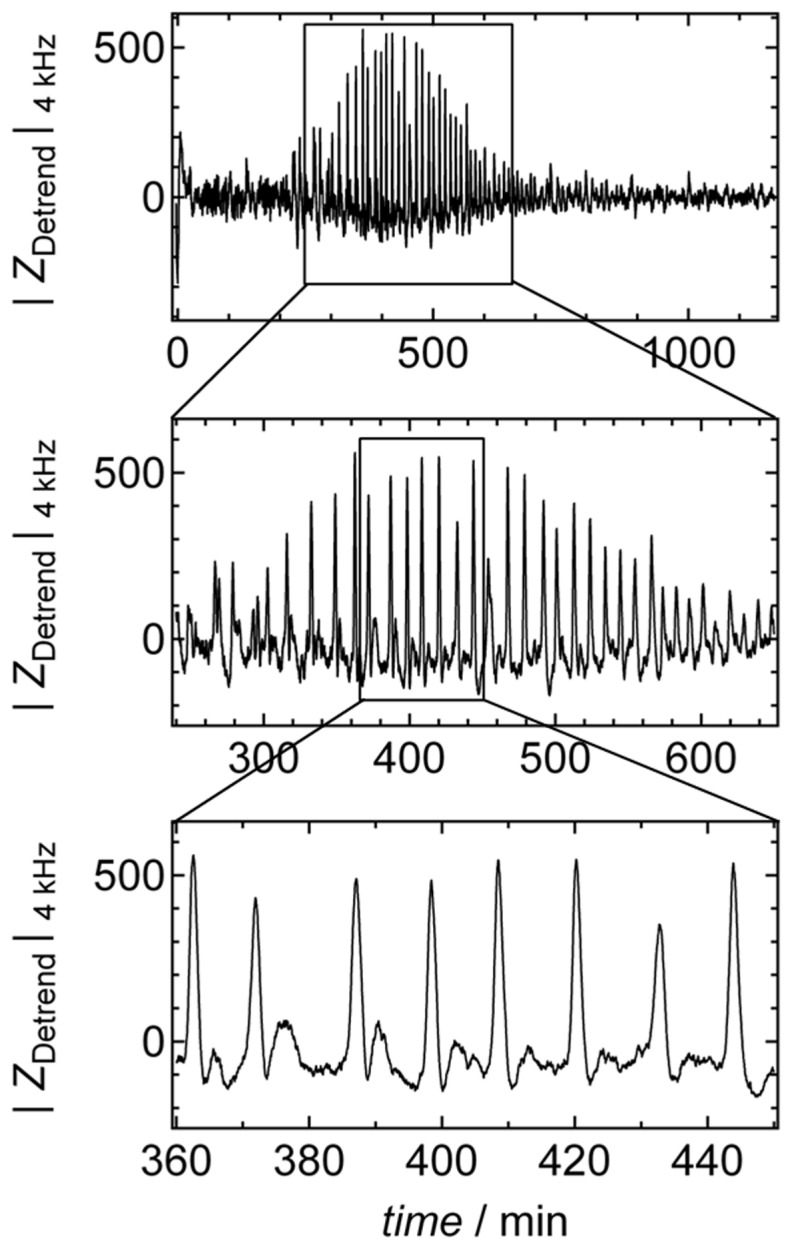
 = 250 µm). Boxes highlight magnification of the impedance signal. Data were smoothed by subtracting a moving average algorithm (box size: 800 points) to remove long-term trends.
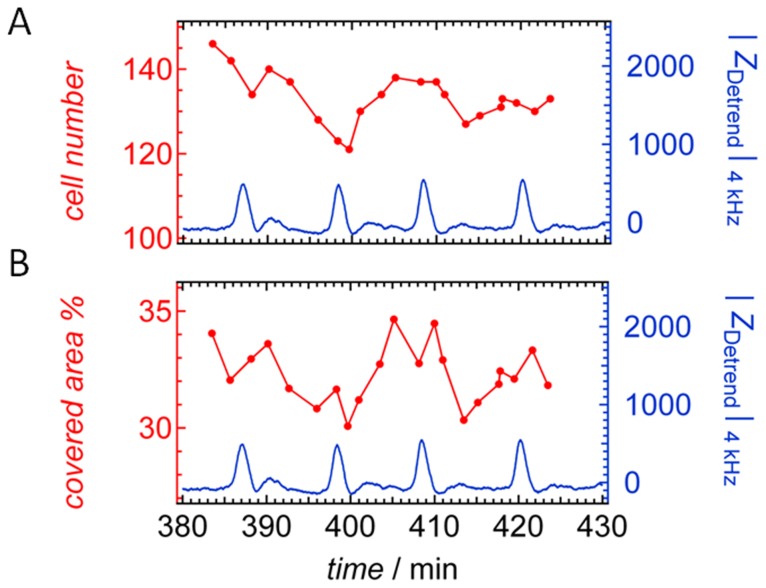
Similar articles
-
Collective behavior of Dictyostelium discoideum monitored by impedance analysis.Commun Integr Biol. 2013 May 1;6(3):e23894. doi: 10.4161/cib.23894. Commun Integr Biol. 2013. PMID: 23713138 Free PMC article.
-
Local and spatially coordinated movements in Dictyostelium discoideum amoebae during chemotaxis.Cell. 1982 Feb;28(2):225-32. doi: 10.1016/0092-8674(82)90340-3. Cell. 1982. PMID: 6277507
-
Imaging G-protein coupled receptor (GPCR)-mediated signaling events that control chemotaxis of Dictyostelium discoideum.J Vis Exp. 2011 Sep 20;(55):3128. doi: 10.3791/3128. J Vis Exp. 2011. PMID: 21969095 Free PMC article.
-
Signaling pathways mediating chemotaxis in the social amoeba, Dictyostelium discoideum.Eur J Cell Biol. 2006 Sep;85(9-10):897-904. doi: 10.1016/j.ejcb.2006.06.003. Eur J Cell Biol. 2006. PMID: 16962888 Review.
-
Dispatch. Dictyostelium chemotaxis: fascism through the back door?Curr Biol. 2003 Apr 29;13(9):R353-4. doi: 10.1016/s0960-9822(03)00274-4. Curr Biol. 2003. PMID: 12725750 Review.
Cited by
-
Shear force-based genetic screen reveals negative regulators of cell adhesion and protrusive activity.Proc Natl Acad Sci U S A. 2017 Sep 12;114(37):E7727-E7736. doi: 10.1073/pnas.1616600114. Epub 2017 Aug 28. Proc Natl Acad Sci U S A. 2017. PMID: 28847951 Free PMC article.
-
Collective behavior of Dictyostelium discoideum monitored by impedance analysis.Commun Integr Biol. 2013 May 1;6(3):e23894. doi: 10.4161/cib.23894. Commun Integr Biol. 2013. PMID: 23713138 Free PMC article.
-
The evolution of adhesiveness as a social adaptation.Elife. 2015 Nov 27;4:e08595. doi: 10.7554/eLife.08595. Elife. 2015. PMID: 26613415 Free PMC article.
-
Initiation of multicellular differentiation in Dictyostelium discoideum is regulated by coronin A.Mol Biol Cell. 2014 Mar;25(5):688-701. doi: 10.1091/mbc.E13-04-0219. Epub 2014 Jan 8. Mol Biol Cell. 2014. PMID: 24403600 Free PMC article.
References
-
- Dormann D, Vasiev B, Weijer CJ (1998) Propagating waves control Dictyostelium discoideum morphogenesis. Biophys Chem 72: 21–35. - PubMed
-
- Chisholm RL, Firtel RA (2004) Insights into morphogenesis from a simple developmental system. Nat Rev Mol Cell Biol 5: 531–541. - PubMed
-
- Kessin RH (2001) Dictyostelium Evolution, Cell Biology, and the Development of Multicellularity. Cambride University Press 1.
-
- Vicker MG, Grutsch JF (2008) Dual chemotaxis signalling regulates Dictyostelium development: Intercellular cyclic AMP pulses and intracellular F-actin disassembly waves induce each other. Eur J Cell Biol 87: 845–861. - PubMed
Publication types
MeSH terms
Substances
LinkOut - more resources
Full Text Sources
Other Literature Sources
