. 2013;8(1):e54261.
doi: 10.1371/journal.pone.0054261. Epub 2013 Jan 18.

Cyclic AMP enhances TGFβ responses of breast cancer cells by upregulating TGFβ receptor I expression

Affiliations

Cyclic AMP enhances TGFβ responses of breast cancer cells by upregulating TGFβ receptor I expression

Ilka Oerlecke et al. PLoS One. 2013.

Abstract

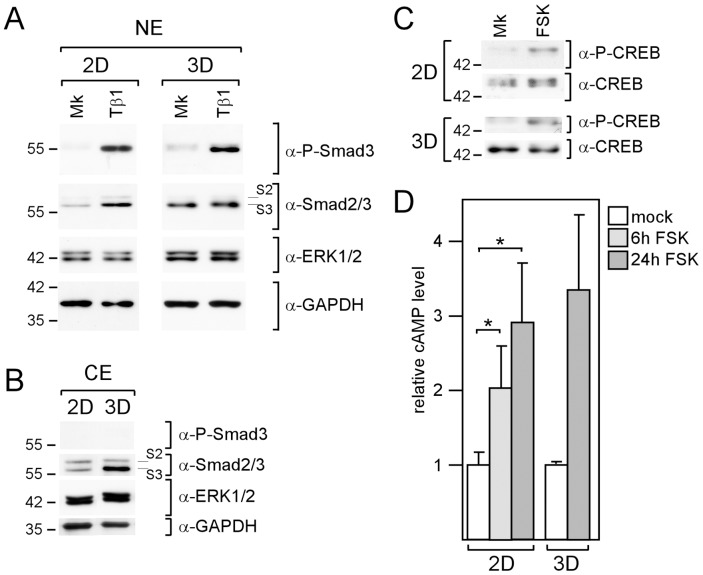
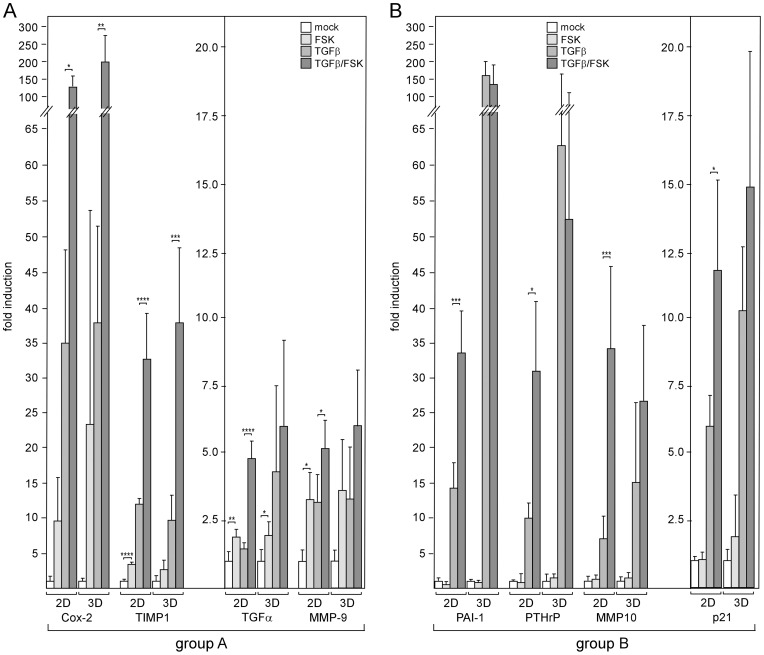
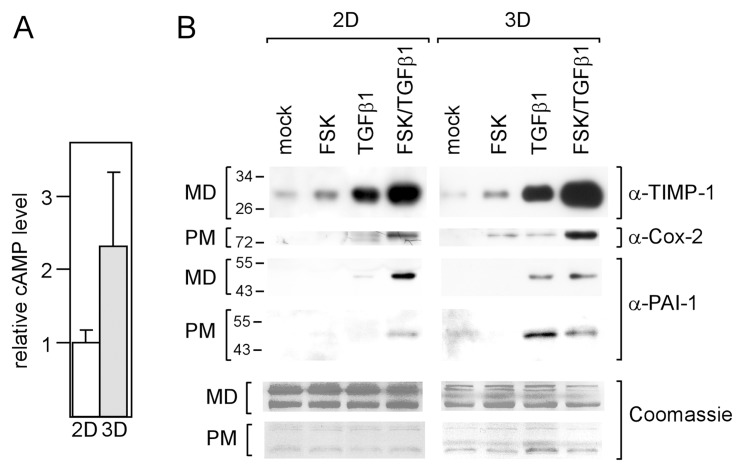
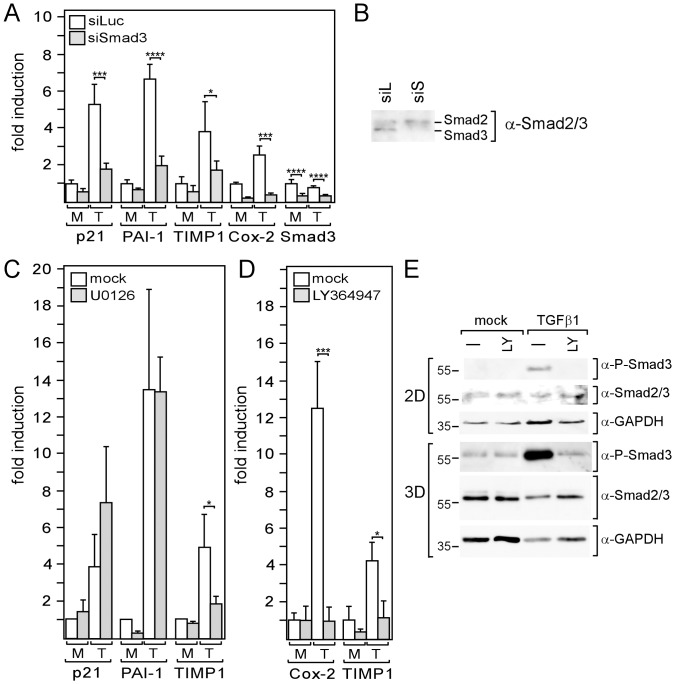
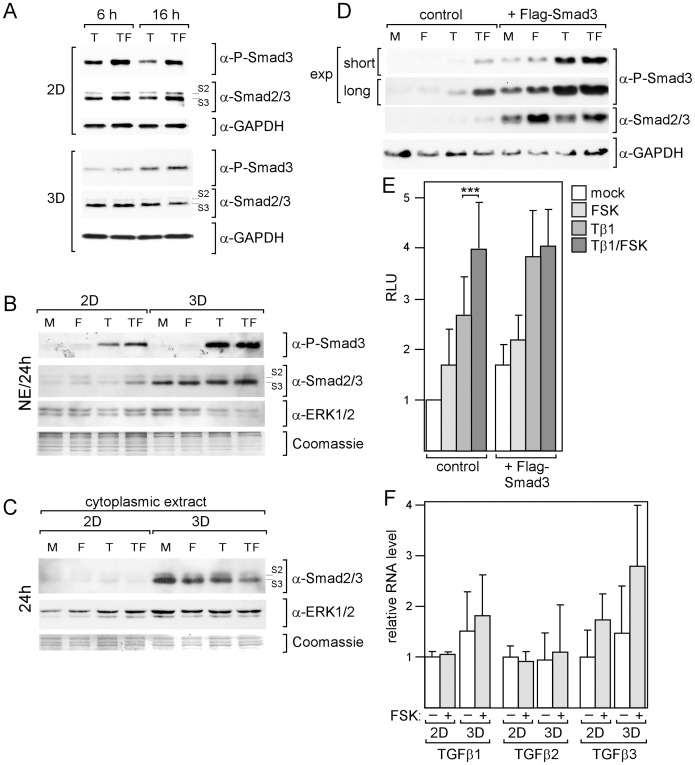
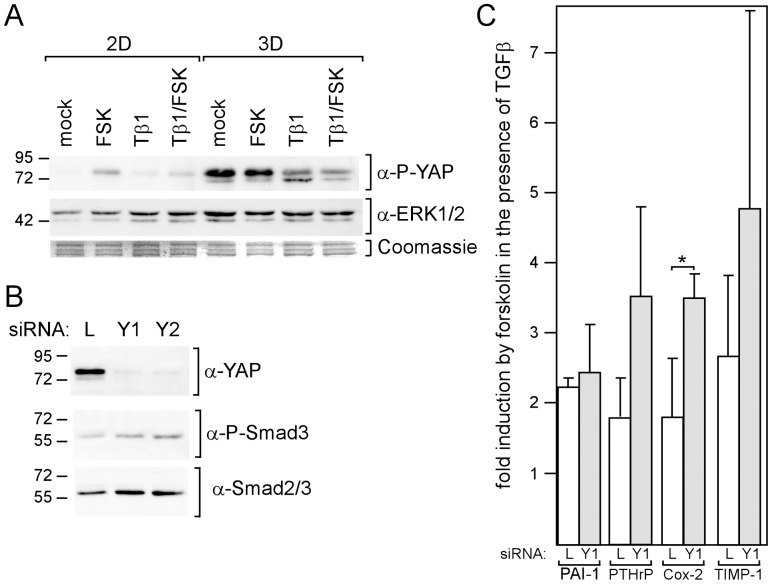
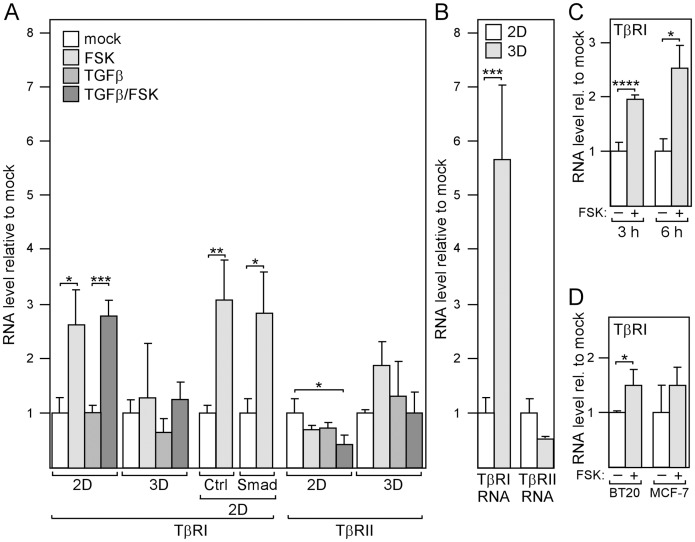
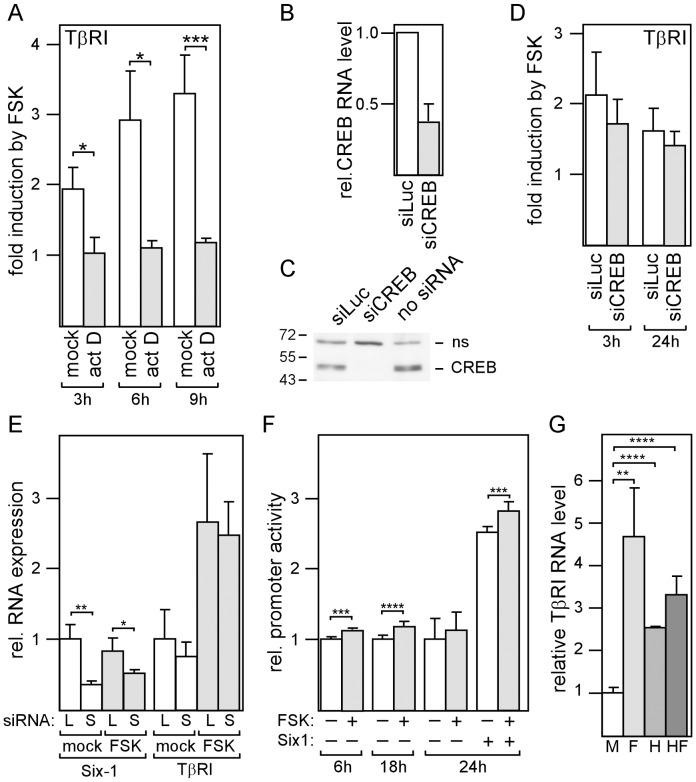
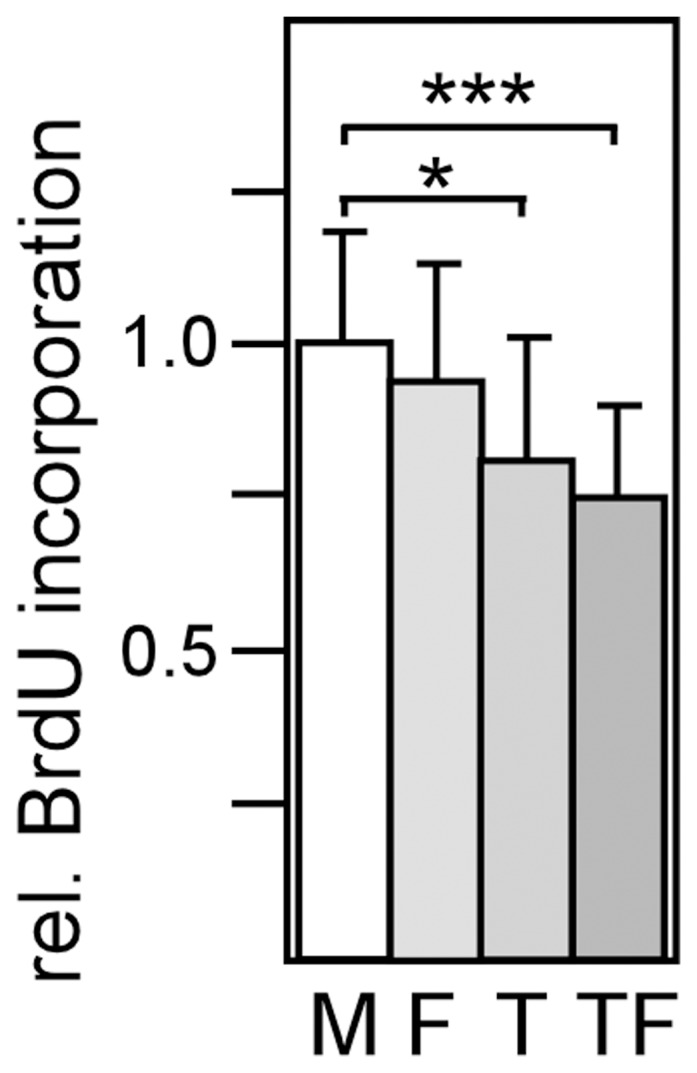
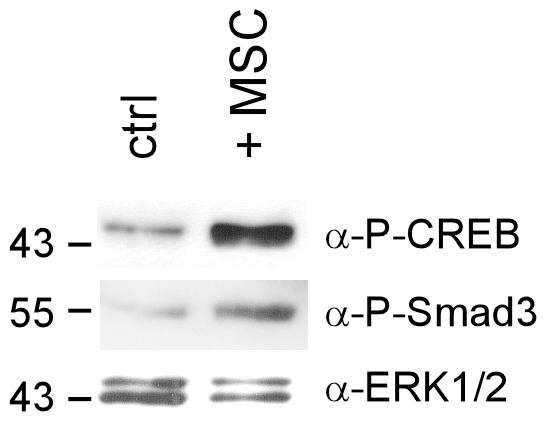
Cellular functions are regulated by complex networks of many different signaling pathways. The TGFβ and cAMP pathways are of particular importance in tumor progression. We analyzed the cross-talk between these pathways in breast cancer cells in 2D and 3D cultures. We found that cAMP potentiated TGFβ-dependent gene expression by enhancing Smad3 phosphorylation. Higher levels of total Smad3, as observed in 3D-cultured cells, blocked this effect. Two Smad3 regulating proteins, YAP (Yes-associated protein) and TβRI (TGFβ receptor 1), were responsive to cAMP. While YAP had little effect on TGFβ-dependent expression and Smad3 phosphorylation, a constitutively active form of TβRI mimicked the cAMP effect on TGFβ signaling. In 3D-cultured cells, which show much higher levels of TβRI and cAMP, TβRI was unresponsive to cAMP. Upregulation of TβRI expression by cAMP was dependent on transcription. A proximal TβRI promoter fragment was moderately, but significantly activated by cAMP suggesting that cAMP increases TβRI expression at least partially by activating TβRI transcription. Neither the cAMP-responsive element binding protein (CREB) nor the TβRI-regulating transcription factor Six1 was required for the cAMP effect. An inhibitor of histone deacetylases alone or together with cAMP increased TβRI expression by a similar extent as cAMP alone suggesting that cAMP may exert its effect by interfering with histone acetylation. Along with an additive stimulatory effect of cAMP and TGFβ on p21 expression an additive inhibitory effect of these agents on proliferation was observed. Finally, we show that mesenchymal stem cells that interact with breast cancer cells can simultaneously activate the cAMP and TGFβ pathways. In summary, these data suggest that combined effects of cAMP and TGFβ, as e.g. induced by mesenchymal stem cells, involve the upregulation of TβRI expression on the transcriptional level, likely due to changes in histone acetylation. As a consequence, cancer cell functions such as proliferation are affected.


Conflict of interest statement

Competing Interests: The authors have declared that no competing interests exist.

Figures

Figure 1
Figure 1. MDA-MB-231 cells are similarly responsive to forskolin and TGFβ in 2D and 3D cultures.
Cells were analyzed for changes in the phosphorylation status of Smad3 (A) and CREB (B) as well as for changes in the cAMP level in response to TGFβ1 and forskolin, respectively. (A-C) Western blot analyses of nuclear extracts (NE) or cytoplasmic extracts (CE) of cells treated with mock (Mk), forskolin (FSK) or TGFβ1 (Tβ1) as indicated for 2 h to study Smad2/3 (S2/3) or CREB phosphorylation by using antibodies specific to phospho-Smad2/3 or phospho-CREB, respectively. To check for equal protein loading, blots were reprobed with anti-GAPDH and anti-ERK1/2 (A, B) or anti-CREB (C). (D) cAMP was measured by EIA as described by Material & Methods. Each bar represents the mean value of three (2D) or two (3D) independent experiments. Error bars denote S.D. * p-value <0.05 (Student’s t-test).
Figure 2
Figure 2. cAMP increases responses of tumor-relevant genes to TGFβ.
MDA-MB-231 cells were incubated with forskolin or TGFβ1 or both or mock-treated for 24 h, lysed and analyzed for RNA levels of TIMP-1, Cox-2, PTHrP, MMP10, PAI-1, TGFα, MMP9 and p21 by Q-RT-PCR. Genes were grouped based on their abilities to respond to forskolin in the absence and presence of TGFβ (group A) or only in the presence of TGFβ (group B) in 2D-cultured cells. For graphical reasons, genes in each group were sorted by their potencies to respond to TGFβ plus forskolin. Genes showing fold induction in response to TGFβ plus forskolin >15 appear in the left graph, those displaying fold induction ≤ 15 appear in the right graph of each group. Each bar represents the mean value ± SD of 3–5 independent experiments. * p-value <0.05, ** p-value <0.01, *** p-value <0.005, **** p-value <0.001 (Student’s t-test).
Figure 3
Figure 3. cAMP levels and forskolin effects are different in 2D
- and 3D-cultured cells. (A) cAMP levels are higher in 3D-cultured cells compared to 2D-cultured cells. Cells were grown in 2D or 3D cultures for 24 h and analyzed for cAMP. Each bar represents the mean value ± S.D. of three independent experiments. (B) cAMP/TGFβ-induced changes in RNA levels are translated into changes in protein levels. MDA-MB-231 cells were incubated with forskolin or TGFβ1 or both or mock-treated for 24 h, lysed and analyzed for protein levels of TIMP-1, Cox-2 and PAI-1 by the Western blot technique. The level of the secretory protein TIMP-1 was measured in the medium (MD) in which cells were grown, Cox-2 protein expression was analyzed in plasma membrane (PM) extracts, PAI-1 levels were determined in both MD and PM. To check for equal loading gels were stained with Coomassie Blue.
Figure 4
Figure 4. Smad3 and/or ERK1/2 are involved in the TGFβ-mediated regulation of genes in MDA-MB-231 cells.
(A, B) MDA-MB-231 cells were transfected with siSmad3 or control siRNA (siLuc) and incubated for three days in 2D cultures before cells were treated with TGFβ1 (T) or mock-treated (M) for 24 h, lysed and analyzed for RNA expression of Smad3, p21, Cox-2, PAI-1 and TIMP-1 by Q-RT-PCR (A) or for nuclear Smad3 protein expression by Western blot analysis (B). (C, D, E) Cells in 2D cultures (C, D, E) or 3D cultures (E) were incubated for 24 h with TGFβ1 (T) or mock-treated (M) in the presence or absence of U0126 (C) or LY364947 (D, E) and analyzed for RNA expression of genes as indicated (C, D) or for nuclear Smad3 and phospho-Smad3 expression (E). GAPDH was used as a protein loading control (E). (A, C, D) Each bar represents the mean value ± SD of 3–6 independent experiments.* p-value <0.05, *** p-value <0.005, **** p-value <0.001 (Student’s t-test).
Figure 5
Figure 5. Forskolin increases phosphorylation of Smad3.
(A-D) Western blot analyses of nuclear extracts (A, B, D) or cytoplasmic extracts (C) for levels of phospho-Smad3 and Smad2/3 (S2/S3). To check for protein loading the blots were reprobed with either anti-GAPDH (A, D) or anti-ERK1/2 (B, C). In B,C also Coomassie-stained proteins are shown. Cells cultured in 2D or 3D were treated with forskolin (F), TGFβ1 (T) or TGFβ1 plus forskolin (TF) or mock-treated (M) for 6, 16 or 24 h as indicated. (D) Ectopic expression of Smad3 not only leads to higher Smad3 levels but also stimulates Smad3 phosphorylation. MDA-MB-231 cells were transfected with an expression plasmid for Flag-tagged Smad3 and incubated o/n prior to treatment with forskolin (FSK), TGFβ1 (Tβ1) or TGFβ1 plus forskolin or mock-treated for 16 hours. Nuclear extracts were analyzed by the Western blot technique for the levels of phospho-Smad3, Smad2/3 and GAPDH (loading control). For P-Smad3 two different exposures (exp) of the chemiluminescent signals are shown. (E) Overexpression of Smad3 blocks the ability of cAMP to potentiate the stimulatory effect of TGFβ on the 3TP promoter containing a PAI-1 TGFβ response element. Cells were transfected with the 3TP promoter/firefly luciferase construct alone or together with a Flag-Smad3 expression plasmid and treated as indicated for 16 h. Cells were lysed and analyzed for luciferase activity. Each bar represents the mean value ± SD of nine independent experiments. *** p-value <0.005. (F) TGFβ1 RNA expression was compared in mock- and forskolin (FSK)-treated 2D- and 3D-cultured cells. Each bar represents the mean value ± SD of three independent experiments.
Figure 6
Figure 6. YAP does not mediate the forskolin effect on TGFβ-mediated gene expression.
(A) Phosphorylation of YAP is increased by forskolin and in 3D cultures. MDA-MB-231 cells in 2D and 3D cultures were incubated with forskolin (FSK), TGFβ1 (Tβ1) or TGFβ1 plus forskolin or mock-treated o/n. Cytosolic extracts were analyzed for the phosphorylation status of YAP by the Western blot technique. To check for protein loading, the blot was reprobed with anti-ERK1/2. Also Coomassie-stained proteins are shown. (B, C) Cells were transfected with siYAP1 (Y1), siYAP2 (Y2) or siLuc (L) and incubated for three days. (B) Downregulation of YAP increases Smad3 nuclear localization. Nuclear extracts of the transfected cells were examined for YAP, phospho-Smad3 and Smad3 protein expression by Western blot analysis. (C) Downregulation of YAP increases the forskolin effect on TGFβ1-mediated gene expression. Transfected cells were incubated with forskolin (FSK) or mock-treated for 24 h and analyzed for Cox-2, TIMP-1, PTHrP and PAI-1 RNA expression by using Q-RT-PCR. Each bar represents the mean value ± SD of three independent experiments. * p-value <0.05 (Student’s t-test).
Figure 7
Figure 7. cAMP stimulates expression of TGFβ receptor I (TβRI).
(A) cAMP increases the expression of TβRI, but not of TβRII. Cells were treated as indicated in 2D or 3D cultures for 24 h and analyzed for the expression of TβRI, and TβRII by Q-RT-PCR. When transfected with Flag-Smad3 (Smad) or mock-transfected (Ctrl) cells were incubated overnight before forskolin or vector (mock) was added. (B) TβRI levels are higher in 3D-cultured compared to 2D-cultured cells. Cells were grown in 2D or 3D cultures for 24 h and analyzed for TβRI-RNA and TβRII-RNA levels. Each bar represents the mean value ± S.D. of three independent experiments. (C) cAMP-dependent induction of TβRI expression is rapid. Cells were incubated with forskolin (FSK) or mock-treated in 2D cultures for 3 or 6 h before RNA expression of TβRI was analyzed by Q-RT-PCR. (D) cAMP stimulates TβRI expression also in BT-20 and MCF-7 breast cancer cells. Cells were incubated with forskolin or mock-treated for 24 h and analyzed for TβRI expression by Q-RT-PCR. Each bar represents the mean value ± S.D. of three independent experiments. * p-value <0.05, *** p-value <0.005, **** p-value <0.001 (Student’s t-test).
Figure 8
Figure 8. Overexpression of TβRI mimics the forskolin effect on TGFβ-driven gene expression.
MDA-MB-231 cells were either transfected with 1 µg of an expression plasmid encoding a constitutively active form of TβRI, TβRI(T204D), or mock-transfected or treated with forskolin. After o/n incubation in 2D cultures cells were analyzed for TβRI RNA levels by Q-RT-PCR (A) or for protein levels of TβRI, Cox-2, TIMP-1, PAI-1, Phospho-Smad3, ERK1/2 (loading control) by the Western blot technique (B). Each circle represents the mean value ± S.D. of three independent experiments. * p-value <0.05.
Figure 9
Figure 9. The forskolin effect on TβRI requires transcription to be active, but is independent of CREB.
(A) MDA-MB-231 cells were incubated with either actinomycin to block transcription or mock-treated for 24 h and analyzed for TβRI RNA levels by Q-RT-PCR. (B-D) Cells were transfected with either siCREB, siLuc or no siRNA, incubated for three days, treated for an additional 3 or 24 h with forskolin or mock (D) and analyzed for TβRI RNA (B, D) or protein levels (C) by Q-RT-PCR or by the Western blot technique (ns = non-specific band), respectively. (E) Cells were transfected with siSix1 (S) or siLuc (L), incubated for three days, treated with forskolin or mock o/n and analyzed for Six1 and TβRI RNA expression by Q-RT-PCR. (F) The TβRI promoter is responsive to cAMP. MDA-MB-231 cells were transfected with TβRI promoter/dual luciferase construct, incubated o/n and treated with forskolin (FSK) or mock for 6, 18 or 24 hours as indicated and analyzed for firefly and renilla (control) luciferase. (G) MDA-MB-231 cells were incubated with forskolin, HDACi III, forskolin plus HDACi III or mock-treated for 24 h and analyzed for TβRI expression by Q-RT-PCR. Each bar represents the mean value ± S.D. of 3 independent experiments. Relative promoter activity denotes the ratio of firefly to renilla luciferase activity. Each bar represents the mean value ± S.D. of 3–10 independent experiments. * p-value <0.05, ** p-value <0.01, *** p-value <0.005, **** p-value <0.001 (Student’s t-test).
Figure 10
Figure 10. cAMP supports the anti-proliferative effect of TGF
β . Incorporation of Bromo-deoxyuridine (BrdU) into DNA was measured in the presence of forskolin (F), TGFβ (T) or forskolin and TGFβ (FT) or under mock conditions (M) as described under Material and methods. Each bar represents the mean value ± S.D. of 10 independent experiments. * p-value <0.05, *** p-value <0.005, (Student’s t-test).
Figure 11
Figure 11. hMSCs activate the TGFβ and cAMP signaling pathway.
MDA-MB-231 cells were co-cultured with hMSCs in a ratio of 300∶1 or left untreated (ctrl) for 3 days before Western blot analyses were carried out. Nuclear extracts were used to examine the phosphorylation status of Smad3 and CREB. Anti-ERK1/2 was used to control for equal loading.

Similar articles

Cited by

References

    1. Ikushima H, Miyazono K (2010) TGFbeta signalling: a complex web in cancer progression. Nat Rev Cancer 10: 415–424. - PubMed
    1. Massague J (2008) TGFbeta in Cancer. Cell 134: 215–230. - PMC - PubMed
    1. Schmierer B, Hill CS (2007) TGFbeta-SMAD signal transduction: molecular specificity and functional flexibility. Nat Rev Mol Cell Biol 8: 970–982. - PubMed
    1. Massague J, Seoane J, Wotton D (2005) Smad transcription factors. Genes Dev 19: 2783–2810. - PubMed
    1. Bierie B, Moses HL (2006) Tumour microenvironment: TGFbeta: the molecular Jekyll and Hyde of cancer. Nat Rev Cancer 6: 506–520. - PubMed

Publication types

MeSH terms

Substances